


Towards formal verification of smart grids: An effective modelling approach and some first experimentation
- Ho Chi Minh City University of Technology (HCMUT), Vietnam National University - Ho Chi Minh City, Ho Chi Minh City, Vietnam
- Sai Gon University, Ho Chi Minh City, Vietnam
Abstract
Nowadays, smart grids are used widely around the world when they enable detecting, reacting and pro-acting to changes in usage and many concerns with the power system, as well as having self-healing capabilities. Some smart grids have recently been created and operational in Vietnam. To ensure the effectiveness of the smart grids, the correctness of the system designs must be studied carefully before the explosion of the use of smart grids, particularly in developing countries such as Vietnam. As formal methods, including formal verification and model checking, recently play more important role in verifying smart grid properties such as load balancing and fault resilience, the effectiveness of formal verification depends mostly on system modeling and verification techniques. Recent researches have shown the feasibility of applying model-checking tools in smart grid verification, and also the inability to test complex properties and systems. In our opinion, the inability could be come from the complicating of the models of the system-under-test. In this study, we suggested a new method for representing smart grids using Colored Petri Net (CPN), a formal representa- tion language. In comparing to the current modeling approach, the new model allows engineers transforms complex grids into simple models. Moreover, based on the advantages of the “color” aspect of the CPN, the result model can be easily upgraded to adapt to the changes of the original smart grids without re- modeling. Also in this study, a basic case study for representing a smart grid, which consists of multiple power sources and multiple consumers, will be shown. The model will be configured to capture some problems that may happen in the grid such as the changing of the capacity of the power sources. The verification experimentation conducted on the case study shows the usefulness of the proposed method.
Introduction
A smart grid is a grid of power system using information and communication technologies to optimize the transmission and distribution of electricity between generators and con- sumers while also consolidating the electricity infrastructure with the inter-information infrastructure. The grid has the basic functions of (1) resisting intentional attacks against the system both physically and in the computer network; (2) reducing the amount of energy consumed on the wire, and improving the quality of electricity; (3) reducing production and transmission costs, and upgrading costs by differentiating electricity consumption; and (4) capable of self-healing in the event of a power failure. Smart grid has begun to be deployed in Vietnam during this decade and is still being deployed 1.
Smart grid studies have been implemented for a long time (see also UCLA Smart Grid Energy Research Center
In general, a formal specification is a specification repre- sented in a formal language 2. In this way, a formalized system is an abstraction of the real system to focus on the representation of what the system does. At that time, the use of mathematics-based formal verification methods will prove the correctness of the whole or show the irrationality of a given system by its formal specification and attribute to be proved3.
Recent studies have indicated that formal methods s 4, 5, 6 can potentially test properties such as load balancing or the probability of a fault happening in the grid (and fault tolerance) for smart grids specifically. These studies also reveal that the performance of formal verification (testing duration, computing resources consumed, and scalability) relies on the system’s modeling and the chosen formal verification method.
Research on formal methods focuses on two main branches, formal specification, and formal verification3. The specifica- tion methods have many research directions such as history- based, state-based, transition-based, functional, special oper- ational, or higher-order functions3. Typical contributions to this branch are temporal-logical representations 7, rep- resentation languages such as Process or Protocol Meta Lan- guage (PROMELA) introduced by Gerard J. Holzmann8, model languages such as Petri nets. In general, studies on formal specifications attempt to construct representation lan-guages/methods that represent a system’s characteristics.
In the second direction of research, researchers focus on modeling the system and modeling these models. This branch consists of two main approaches: theorem proving and model checking 3. While the theorem proving is based on inference laws to prove the correctness of the system, the model check- ing is based on search algorithms to find counter-examples of the system’s improperness. Currently, there are many powerful tools to help scientists continue to implement new tests, as well as help users test their practical systems. Some of them are SPIN
The specific studies on formal methods in the field of smart grid can include the two latest research branches4, 5, 6. The first branch of research4, 5 proposes to apply the NuSMV tool in testing some properties such as load balance, and resilience of the mesh system. Research results (using NuSMV) show the feasibility of applying model-checking tools in smart grid verification. However, it also shows an inability to test more complex properties due to limited com- puting resources (memory). Another possible reason is that the modeling approach presented by the study is still too complex. In addition, the study has not shown ways to use more scalable studies such as abstraction or/and random path 9.
The second branch of research6 focuses on fault prob- ability and system recovery probability in smart grids using both wired and wireless communication. Similar to the study above, this work also models the system using a model testing tool called PRISM. However, the model used to illustrate the project is still quite small and the feature to be tested is still simple.
The most notable studies on modeling and testing the system model have been studied in10, 11, 12, 13, 14. These studies focus on modeling wireless sensor networks and using abstraction techniques, clustering, etc., applying model testing algorithms to verify congestion characteristics of wire- less sensor networks. In addition, the congestion probability is also taken into account when applied in practice with unstable network parameters. In addition, the research on improving the effectiveness of model checking has also been studied in9, 15, 16, 17, 18, 19 with abstract methods, parallelization, randomization, heuristic search, indexing, etc.
Researches on verification of smart grids in Vietnam seem- ingly have not been published.
This research contributes the following three-folds: (1) smart grid representation using Color Petri nets14; (2) a smart grid case study consisting of a set of sample smart grids of three types: many power sources, many consumers, unstable power sources; (3) Some verification experimentation conducted on the case study to show the usefulness of the proposed method.
The rest of this paper is organized as follows. In the next section, background information is presented. The proposed formal representation approach for smart grids is then pre- sented in section 3. The testbed and some experimental results are described in section 4. The final part of this paper discusses the main findings and the directions for future research.
Background
Smart grids
A smart grid is an electric grid or network that enables the management of smart devices based on data gathered from the network to react quickly to demands for electricity. It allows to enhance the electric network in reliability, availability, and efficiency.
The smart grid can be categorized by levels such as the customer, the distribution system, and the transmission system during operation. At the customer level, it may involve some things like meters that can be read automatically, meters that communicate to customers, control of customers’ loads, and flexibility in the use of time-of-day or time-of-use meters. At the distribution level, system may involve distribution system automation, selective load control, managing distributed gen- eration, and ”islanding”. And the transmission level, system may involve measurement of phase and other advanced mea- surements, and other advanced control devices, distributed and autonomous control 18.
The main objectives of designing smart grids are to achieve grid visibility, enable asset control, improve power system performance and security, and lower the expenses of operation, maintenance, and system planning. In the research of smart grid, there are some computational tools for modeling and analysis of the smart grid20, 21, 22, 23, 24, 25, as well as studies on threats and solutions26.
Formal verification
Formal verification is a research direction aimed to prove the correctness of a system with respect to a certain property rep- resented in a formal specification. Theoretically, verification is a process of finding formal proof on a formal/mathematical model of the system under test. There are two main ap- proaches in formal verification: model checking and theorem proving3.
In model checking, a finite model of a system is used for searching for evidence of a violation of the desired property. The system is verified when no such violation evidence exists or a counter-example will be shown. It is a very practical approach, even though in the explosion of the state space, the search (for violation) can stop within a limit of computer resources and running time and returns the correctness with some confidence level 27. The well-known logic used in model checking is temporal logic, which aims to capture the temporal aspect of the property. For example, one can check if a smart grid satisfies the property “Definitely, the top priority consumer will receive enough energy as required”. Although, in theory, the search in the state space is exhaustive, there are researches in the model checking field to overcome this drawback9, 15, 16, 17, 28.
In theorem proving, both the system and its desired prop- erties are expressed as formulas in some mathematical logic, which is based on axioms and inference rules. By that logic, it can deal directly with infinite state space, while model checking can hardly. However, some of the theorem techniques are used in practice with excellent results28.
Colored Petri Nets
A Petri net is a system model that uses a weighted, directed graph of nodes as places and transitions. Directed arcs connect places to transitions (as inputs) and transitions to places (as outputs). The Petri networks by moving tokens from (input) places to transitions and from transitions to (output) places (firing). The weight of the directed arcs determines the number of tokens moved (transmitted).
Colored Petri net (CPN)14 is an extension of Petri net that merges the benefits of Petri nets with the expressive power of functional programming languages by giving more features and properties to tokens, places, and transitions resulting in more classes of high level. It enables tokens to have a data value attached to them called the token color, and each place represents a color set. Furthermore, arc-expressions (an extended version of arc weights in classical Petri nets) determine which tokens can flow over the arcs. Additional guard constraints on enabling transitions can also be expressed as Boolean expressions.
A Colored Petri net is a tuple CPN= (ColBagPlaTrnV arFun), where
-
Col define a finite set of color sets. -
Bag is a bag of tokens (value) of colorsc ∈Col . -
Pla define a finite set of places. -
Trn is a finite set of transitions. -
V ar is a finite set of variablesv ∈V ar . -
Fun define a finite set of functions.

Colored Petri Net (CPN).
For example, Figure 1 shows a CPN in its two stages: enabling and firing. In Figure 1(a), place P 1 consists of 2 bags of integer tokens (one with five (5) tokens and another with three (3) tokens), and place P 2 contains a bag of four (4) integer tokens. They are the input places for transition T 1 with the guard expression x > y (from P 1 and P 2, respectively) as the condition to enable the transition. In Figure 1(b), the transition T 1 has been fired when the guard expression is confirmed (the bag of 5 tokens in P 1 and the bag of 4 tokens in P 2). It removed those tokens from place P 1 and P 2 and produced tokens in P 3 (a bag with 14 integer tokens as the outcome of the output arc-expression 2x + y).
RESEARCH METHODOLOGY
We employ a smart grid whose topology is shown in Figure 2, as an illustrative case study 01 in this paper.
The smart grid in Figure 2 contains three generators, three consumers, two buses, and seven circuit breakers (CBs).
A generator can either be a normal generator or a smart generator. We refer to these elements as nodes in the grid. In this demonstration, we assume that these generators are normal generators that can generate stable power. Generator G1 can generate 10MW, G2 can generate 5MW and G3 can generate 6MW. Three consumers require 6MW, 9MW, and 6MW respectively. The total amount of power produced can satisfy the total amount of power required.

Topology of a sample smart grid.
It is also assumed that all elements in a smart grid have standard parameters such as id and type. Moreover, some of them such as generators and consumers have additional parameters such as a capacity for their generating capacity or consuming capacity. Table 1 is for the standard parameters for each grid element. An actual configuration of the grid in Figure 2 is described in Table 2.
The parameter type of the Grid
|
Generator |
Consumer | |
|
Id |
Number |
Number |
|
Type |
Enum |
Enum |
|
Capacity |
Number |
Number |
The parameter configuration of the Grid
|
Item |
Id |
Type |
Capacity |
Unit(POWER) |
|
Generator 1 |
1 |
GEN |
10 |
MW |
|
Generator 2 |
2 |
GEN |
5 |
MW |
|
Generator 3 |
3 |
GEN |
6 |
MW |
|
Consumer 1 |
4 |
CON |
6 |
MW |
|
Consumer 2 |
5 |
CON |
9 |
MW |
|
Consumer 3 |
6 |
CON |
6 |
MW |
Smart grid representation using Color Petri nets
Based on characteristics of a smart grid, we proposed that the grid can be represented using two generic components: generation and transmission/ consumption. Each of these com- ponents is modeled by a CPN.
An illustration of those representations is in Figure 3. Figure 3(a) is a pure petri net created from the topology in Figure 2 by reducing the busses and CBs. The left part of the petri net describes the power generation with three Generators G1, G2, and G3. From these three generators, power is generated through transitions gen1, gen2, and gen3 and is stored in the place “Generated”. After being generated, power will be transferred and consumed in place “Consumer C1”, “Con- sumer C2” and “Consumer C3” through transitions trans1, trans2 and trans3, respectively.
To use the power of the Color Petri net for making a simpler net, all generators and consumers are merged into the places Generator and Consumer, respectively, as displayed in Figure 3(b). All generators (gen1, gen2, gen3) and transi- tions(trans1, trans2, trans3) have also been folded to functions fn_gen, fn_trans, and fn_cons as in Listing 3 to describe power generation, transmission, and consumption, respectively.
Figure 4 and Figure 6 show the details of two folded compo- nents, which will be explained in more detail later.

Two components: basic generation and basic transmission (a); folded generation and folded transmission (b)
The declarations are presented using the Coloured Petri Net- Modelling Language (CPN-ML) syntax of the CPN Tool
Color set types:
-
“IDX”: integer, a unique id of a node in the grid.
-
“TYPE”: enumeration = [GEN,CON] for Genera- tor and Consumer (Load).
-
“CAPACITY”: integer, the capacity of a generator or consuming capacity of a consumer.
-
“NODE”: a record of IDX * TYPE * CAPACITY, a node in the grid.
-
“POWER”: an amount of power.
-
“NODE_POWER”: a product of “NODE” and “POWER”, for power generated or consumed by the NODE.
The configuration of the grid described in Table 2 is in Listing 2. It is also called the initial marking of the CPN. Listing 2 shows the initial marking of the “Generator”, “Generated” and “Consumer” place. Generators are initialized with full energy production capacity. Generated place contains zero power at the initial stage.
Listing 3 describes three functions for power generation, power transmission, and power consumption. How these func- tions work is described in section below.
Listing 1
Declarations of the color sets.
-
c o l s e t IDX = i n t
-
c o l s e t TYPE =
-
c o l s e t CAPACITY = i n t
-
c o l s e t POWER = i n t ; 5
-
c o l s e t NODE = r e c o r d i : IDX* t : TYPE* c : CAPACITY
-
c o l s e t NODE POWER = p r o d u c t NODE*POWER;
Listing 2
Initial marking of the place “Generator” and place “Consumer”.
8 v a l i n i t G e n e r a t o r : NODE POWER =
9 [ ( { i = 1 , t = GEN, c = 10 } , 10 )
10 , ( { i = 2 , t = GEN, c = 5 } , 5 )
11 , ( { i = 3 , t = GEN, c = 6 } , 6 ) ]
12 ;
13 v a l i n i t C o n s u m e r : NODE POWER =
14 [ ( { i = 4 , t = CON, c = 6 } , 0 )
15 , ( { i = 5 , t = CON, c = 9 } , 0 )
16 , ( { i = 6 , t = CON, c = 6 } , 0 ) ]
17 ;
18 v a l i n i t G e n e r a t e d : POWER = 1 ‘ 0
Smart grid component representation
We provide more details about the components mentioned above in this section. The generation component has a tran- sition “gen” and two places “Generators”, “Powers”. The Generators place holds all generators of the smart grid.
For example, the Generator place in Figure 4 contains three generators G1, G2, and G3 of the smart grid in Figure 2, with the configuration as in Table 2. The Generator G1 (ID: 1, maximum power generation capacity: 10) is setup to generate power of 8 (80% of maximum capacity) is represented as ({i = 1, t = GEN, c = 10}, 8). This approach allows us to easily simulate the on/off state and the stability of the power source.
In this component, the transition ”gen” fires when taking one NODE_POWER token from the place “Generator”, this color token represents a generator and its associated power generation. And a POWER token from the place “Generated”, which represents the total amount of electricity that has been produced and stored. The function fn_gen will sum the amount of electricity available from the generator and the amount of electricity available in the place “Generated” to create a new total.
Figure 5 depicts the state of the grid implemented on the CPN Tool after the transition “gen” fires once upon receiving G2 tokens ({i = 2, t = GEN, c = 5}, 5) (from the Generator place) and 0 power (the token 1‘0 in the Generated place) to generate 5 powers (the new token 1‘5 in the Generated place and no more token of G2 in the Generator place).
Listing 3
Three functions are used in the CPN
19 fun fn_gen ( p1 : POWER, p2 : POWER) = p1+ p2 ;
20 fun f n _c o n s ( n : NODE, p : POWER) =( n , p +(# c ( n ) ) ) ;
21 fun f n _t r a n s ( n : NODE, p :POWER) = p −(# c ( n ) ) ;

The folded generation component.

The implementation of the folded generation component on CPN tool

The folded transmission component
After being successfully generated, the electric power is ready to be transmitted and consumed using the transmission component. The “Consumer” place in Figure 6 contains all consumers of the grid with initial configuration. For example, the Consumer C2 (ID is 4, the demand for power is 6, and the amount of power received is 0) is represented as ({i = 4, t = CON, c = 6}, 0). Transition “trans” fires when it receives one token from place “Generated” and one from place “Consumer”. The function fn_trans and fn_cons are used for transferring and consuming power between two places “Generated” and “Consumer” Figure 7 describes a state of the grid when the place Consumer C2 received 6 powers (the token is changed to 1‘({i = 4, t = CON, c = 6}, 6).
Figure 8 shows the complete model of the sample smart grid. It is clear that the CPN model is small regardless of the complexity of the smart grid.

The implementation of the folded transition component on CPN tool

The implementation of the full model on CPN tool
State Space
The state space in CPN is a set of possible configurations that system can have. For the demonstration case study 01, it is a collection of potential states of the grid in Figure 2. In this work, we use the built-in State Space module in CPN Tool to examine state space and Graphviz
In our case, nodes named from 40, 42 to 48 are the final states of the grid, when there is no more firing. For example, node 40 in Listing 5 shows a result when Consumers 1, 2, and 3 receive 0, 18, and 0 powers respectively and 3 redundant powers (token 1‘3) is still at the ”Generated” place. This is not the success of the smart grid, absolutely.
Listing 4
A part of State space report file
-
S t a t i s t i c
-
−−−−−−−−−−−−−−−
-
S t a t e Space
-
Nodes
-
Arcs
-
Secs
-
S t a t u s : F u l l
-
Scc
-
Nodes
-
Arcs
-
Secs
-
. . .

The Graphviz code for exporting state space to dot file
Figure 9 represents a block of code in the CPN tool for exporting state space to the “StateSpace.dot” file. Figure 11 shows a part of the full state space in Figure 10.
Listing 4 shows that the state space of case 01 consists of 48 nodes and 96 arcs. The running time for the analysis of this state space was almost zero seconds and the state space was fully analyzed.

State space report and statespace.dot file
Listing 5
A part of State space .dot file
-
d i g r a p h _c p n _t o o l s _g r a p h {
-
N40 [ l a b e l = 4 0 :
-
s g r i d ’ G e n e r a t e d 1 : 1 ‘ 3
-
s g r i d ’ G e n e r a t o r 1 : empty
-
s g r i d ’ Consumer 1 :
-
1 ‘ ({ i = 4 , t = CON, c = 6 } , 0) ++
-
1 ‘ ({ i = 5 , t = CON, c = 9 } , 18 ) ++
-
1 ‘ ({ i = 6 , t = CON, c = 6 } , 0 ) ]
-
N42 [ l a b e l = 4 2 : . . . ]
-
. . .
-
N1 −
-
{ p2 = 0 , gen ={ i = 2 , t =GEN, c = 5 } , p1 =5} ]
-
N1 −> N3 [ l a b e l = A2 : 1−>3: gen
-
{ p2 = 0 , gen ={ i = 3 , t =GEN, c = 6 } , p1 =6} ]
-
N1 −> N2 [ l a b e l = A1 : 1−>2: gen
-
{ p2 = 0 , gen ={ i = 1 , t =GEN, c = 10 } , p1 =10} ]
-
. . .

A part of full state space
Experimental setup
We aim to show how our suggested method can model a realistic version of a smart grid in this section. The grid’s setup in two different case studies is presented in Table 3.
In case study 02, we simulate the unstable power supply and the stable consumer demand. For example, Generator G1 can vary its capacity from 80% to 100% (9 to 12 power). By this simulation, the state space can be used to analyze situations such as when all consumers ask for their demands, then what are the power production levels of all generators.
For case study 03, some power generators may be shut down randomly to simulate network failures.
The configuration (setup) of the Grid in three case studies.
|
Case |
Configuration |
|
01 |
Capacity power of generators are fixed |
|
02 |
Generators can change from 80% to 100% of its capacity |
|
03 |
Three Generators can change from 80% to 100% of its capacity and on-off randomly |
Result and Discussion
In this section, we analyze the modeling result and the experimental results of three case studies. Table 4 shows the state space reports generated for the three case studies.
Smart Grid modeling discussion
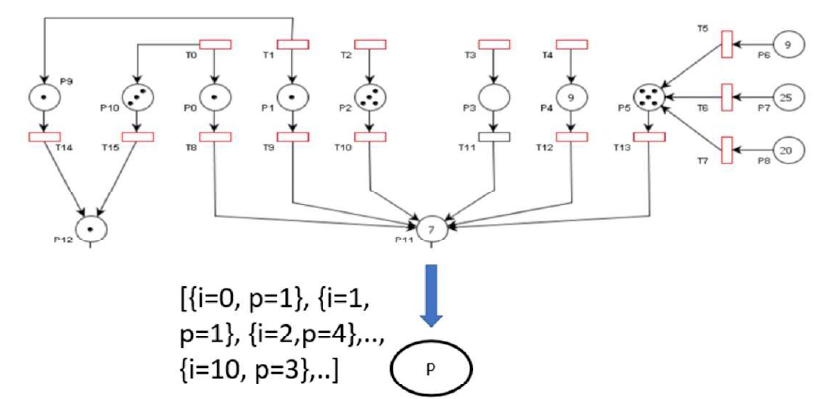
Petri nets or Colour Petri nets have been used to model and verify smart grids in earlier research22. They all aim to mimic the network structure as closely as possible and use some verification methods to check some required properties. For instance, in22, all generators are places in a Petri net. This is convenient for engineers to simulate the nets as they know the topologies well. However, for big networks, the Petri nets are too complex to be shown and simulated and too difficult to be updated. Even the work in 24 that uses CPN to model grids still has large models when it concentrates on describing detailed/local electrical transformer areas to find and locate illegal loads. In our proposed approach, all generators (and their parameters) are color tokens, and the whole topology is reduced to a few simple components with flexible configurations. For example, the net in 22 with 11 generator nodes (P0 to P11) can be represented using our approach with only one node (Node P using the color token [{i=0, p=1}, {i=1, p=1, {i=2, p=4}] in which i is the name of a node, p means power) as illustrated in Figure 12.
Therefore, our models are easy to be updated and re- configured. Tools to convert from a smart grid to our net will be provided.

A part of the net in
Experimental results and discussion
In case 02, the report consists of 367 nodes and 5 474 arcs. There are 6 nodes where the consumers receive their desired amount of power. These are our destination nodes. Of course, we need to travel in the state space to determine the paths from the initial node to the final node. Those paths are the configurations for the smart grid to be successfully operated.
For case 03, the state space consists of 536 nodes and 13 691 arcs, much more nodes and arcs compared to that of case
02. There are still 6 destination nodes to indicate the success of the configuration of the smart grid. However, the running time and computer resources from finding such “successful configurations” are still small, almost zero seconds.
Conclusions
In this paper, we have proposed a modelling approach based on CPN to represent the electrical smart grids. Interestedly, the complexity of the smart grid seems not to be the complexity of the CPN model when all components and topology of the
grid can be modelled in a small CPN and configuration/ arc- expression/ functions.
One of the good things in our approach is that any smart grid represented using this model can be upgraded easily as demonstrated in this paper. Unfortunately, there many other features of smart grids have to be studied more carefully. In the near future, we are going to study how to represent and verify more features such as (1) power loss in smart grid, (2) using batteries to re-balance to smart grid in on-/off-peak period, etc. Moreover, studies on avoiding formal verification drawbacks such as state space explosion in checking the properties have also been carried out carefully.
Finally, we will also offer a tool that allows engineers to specify the smart grid structure and transform it into our CPN models in the upcoming future.
The results of three case studies
|
Case |
Nodes |
Arcs |
Run time (sec.) |
Excepted nodes |
State space |
|
Case 01 |
48 |
96 |
∼ 0 |
1 |
full state space |
|
Case 02 |
367 |
5 474 |
∼ 0 |
6 |
full state space |
|
Case 03 |
536 |
13 691 |
∼ 0 |
6 |
full state space |
Acknowledgment
Vietnam National University - Ho Chi Minh City provided funding for this study under grant number C2020-20-32.
Conflict of Interest
The manuscript has no conflicts of interest with other authors and has not been submitted to other journals.
Author contributions
Author Thang Bui is the guide and provides the main ideas for researching the topic; contributed many important ideas for author Tuan Bui to write and revise the article. As the responsible author (main contact author) of the article, approve the article for submission. Author Liem Nguyen is the guide and came up with the idea to research the topic; Comment on articles and participate. Author Tuan Bui, the first author, wrote the draft of the article, performed the simulation and wrote and edited according to critical comments and according to the suggestions of authors Tuyen Nguyen, Anh Nguyen and Huan Luong.