


Application of the Schlieren Optical Visualization to Experimental Design of a Test Rig for Diesel Engine Combustion Analysis
- Faculty of Automotive Engineering Technology, Industrial University of Ho Chi Minh City (IUH), Ho Chi Minh City, Vietnam
Abstract
Engine power and exhaust emissions result from the in-cylinder's fuel combustion process. The test rig for combustion visualization is one of the modern and specialized systems with high precision requirements. This research aims to design and fabricate a Constant Volume Combustion Chamber (CVCC) to investigate the combustion characteristics under various operating conditions such as fuel injection pressures, ambient pressures, ERG ratios, etc. This design concept depends on the diesel engine operating conditions with compression ratios of up to 26, fuel injection pressure in the range of 1600 bar; be the ability to combine the Z-type Schlieren optical method and high-speed camera to collect images of the combustion process. The strength of the structure was analyzed by ANSYS software with conditions of combustion pressure at 100 bar and 200 bar. This design was fabricated and experimented with the combustion conditions at ambient pressure of 42 bar, oxygen concentration of 21% after the pre-combustion phase, and fuel injection pressure of 800 bar, 1000 bar, and 1200 bar, respectively. The results revealed that the combustion chamber satisfied the durable requirement criteria, with the safety factor of 8.6 and 4.3 respectively under the mentioned simulating conditions. The leakage rate is negligible with 0.01% at an applied compression pressure of 80 bar in CVCC, approximately. The CVCC system can perform and record combustion process parameters at conditions similar to operating the diesel engine.
Introduction
Large power and high thermal efficiency are characteristics that make diesel engines widely used in various fields. However, emission concentrations such as nitrogen oxides (NOx), and particulate matter (PM) during the combustion process are limited to the diesel engine for meeting the current emission standards.1, 2 In order to solve those problems, applied solutions such as high-pressure fuel injection, exhaust gas recirculation (EGR), and the use of several alternative fuels, etc have been extensively researched and developed.3 However, to evaluate the power, and exhaust emission based on the mentioned solutions above, the recording combustion process parameters is very necessary. Therefore, several optical access and combustion measurement devices have been introduced, including Optical Research Engines (ORE), Rapid Compression and Expansion Machine (RCEM), Constant Volume Combustion Chamber (CVCC), Constant Pressure Flow Rig (CPFR), Constant Volume Hot Cell (CVHC), etc. 3, 4, 5, 6, 7, 8 Among these mentioned devices, the outstanding common point is able to simulate various combustion conditions in diesel engines.
Figure 1 shows the range of pressure and temperature conditions prior to fuel injection by different optical access devices. Depending on a compression ratio, these research devices can create ambient pressure and temperatures ranging from 4.5 MPa to 15 Ma and 750 K to 950 K, respectively, corresponding to gas densities between 20 kg/m and 60 kg/m. In particular, pre-injection conditions of CVCC cover a wide range and can simulate various conditions in diesel engines.9 With CVCC, a compression ratio can be easily varied by adjusting the intake combustible gas mixture pressure and pre-injection conditions. Moreover, due to its simplicity in design, feasibility in fabrication, and operation, the CVCC has become a potential device for optimizing operating conditions in diesel engines and evaluating the feasibility of alternative fuels based on recording combustion process parameters.9, 10
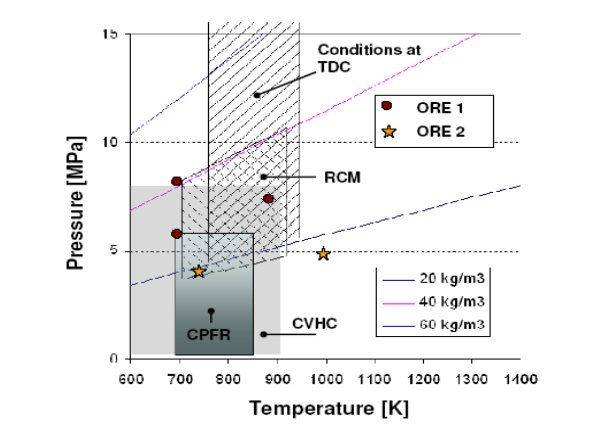
In-cylinder conditions prior to the fuel injection compared to different optical test rigs [7].
Most CVCCs are designed in a cylindrical shape with diameters ranging from 50 mm to 300 mm and widths from 29 mm to 410 mm; gas densities, ambient pressures, and temperatures range from 7 kg/m to 45 kg/m, 1 bar to 50 bar, and 300 K to 1200 K, respectively; the test fuels are injected by various injectors at pressures ranging from 500 bar - 1800 bar. Oren et al.,11 used a cylindrical-shaped CVCC with a diameter of 101.6 mm; their CVCC did not use a mixing fan but instead used a mixing tank external to ensure homogeneous mixtures during the pre-combustion phase for evaluating fuel spray characteristics and combustion behavior in diesel engines. Siebers and Edwards12 and Nguyen et al.13 also used a smaller CVCC (80 mm in diameter); combustion chambers used a mixing fan to achieve homogeneous intake mixtures. The experimental conditions included various pressures and temperatures in the range of 8 bar to 80 bar and 600 K to 1600 K to evaluate ignition delay and combustion characteristics of biodiesel and hydrogen fuels. Fujimoto et al., investigated the impact of oxygen concentration in diesel engines on soot formation to meet increasingly stringent emission standards by using a CVCC with an external hexagonal shape and an inner diameter of 70 mm.12, 13, 14, 15, 16, 17 Most studies primarily focus on the applications of CVCC in the combustion process of alternative fuels. A few studies concentrate on design parameters and structural analysis, while the integration of topics such as design, structural simulation, fabrication, and operational reliability evaluation (such as swirl velocity, EGR levels, temperature distribution, etc.,) of the CVCC system has not been introduced.18, 19, 20 Based on the Schlieren optical approach, this paper presents the method for designing, simulating, analyzing the structural, and experimentally fabricating the CVCC combustion chamber. The leak test and temperature distribution inside the CVCC combustion chamber are evaluated prior to conducting fuel combustion experiments. The experimental investigation of the fuel combustion characteristics in the CVCC system is performed under operating conditions of 42 bar ambient pressure, 21% Oconcentration after the premixed combustion stage, and fuel injection pressures of 800 bar, 1000 bar, and 1200 bar. This yields scientifically and practically valuable results for studying the combustion process. Additionally, it serves as the foundation for further research on various types of fuels, contributing to the resolution of fossil fuel issues.
RESEARCH METHODS
Design criteria
The volume of the CVCC has a significant impact on the simulation of the combustion process inside the chamber. If the chamber volume is too small, it can impede the fuel injection from the injector, as well as the fuel sprays are able to impinge on the chamber walls. Conversely, if the chamber volume is too large, it can affect the measurement results inside the chamber. Therefore, the chamber dimensions need to be warily calculated and optimized. To avoid fuel spray impingement on the chamber walls, the maximum penetration depth (X), and the spray angle (θ) can be determined using the equation proposed (1), (2) by Wakuri et al.21
Where
C: Flow coefficient
: Air density (kg/m)
: Fuel density (kg/m)
P: Different pressure between injection and chamber pressure (N/m)
t: Time after injection (ms)
d: Nozzle diameter (m)
Schlieren optical method
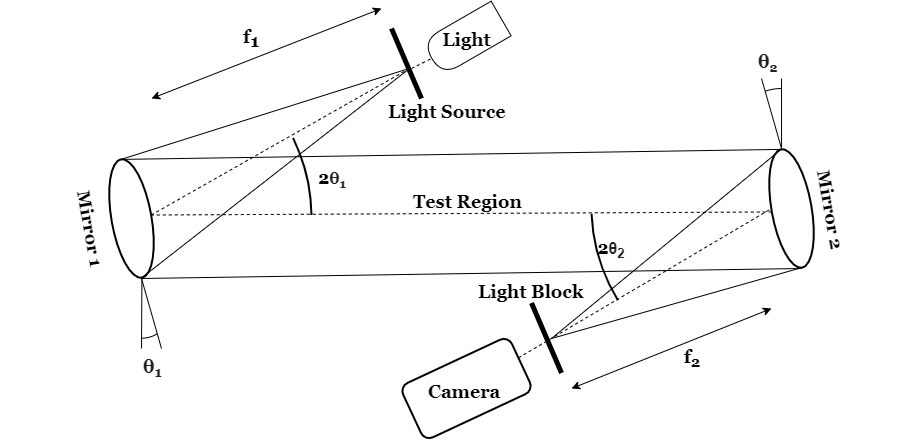
The schematic diagram for the optical method of Z-type Schlieren setup
Figure 2 illustrates the Z-type set-up mirror system applied to the Schlieren optical method, which was commonly employed in combustion process observation experiments. A light source emits light and passes through a narrow slit, allows to become a point light. This light continues to pass the first mirror and transform into parallel rays, passing through the observed object. Subsequently, the light is directed to the second mirror and converges the light beams at the focal point. Thank a knife edge positioned to cover a portion of light, and the difference in refractive index when light passes through with various ambient conditions creates the contrasted image on the screen, enabling to observer of the state transformation.22, 23
2.1. Pre-combustion technique method
The combustion process of the CVCC occurs in two stages, as shown in Figure 3 . The first stage is the combustion of the premixed gas combustible mixture to generate high pressure and temperature, known as the principle of the pre-combustion technique method. The premixed gas combustible mixture consists of Acetylene (CH), Nitrogen (N), and Oxygen (O) is sequentially fed into the chamber through an intake valve and homogenized by a mixing fan.14 Subsequently, the spark plug ignites this mixture completely. The chemical equation for the complete combustion of the specific premixed gas combustible mixture is represented by equation (3). As a result, the pressure inside the chamber initially increases and then decreases due to heat transfer through the chamber wall, the end of the pre-combustion phase.
3.5% CH + 68.5% N + 29.75% O 21% O + 7% CO + 3.5% HO + 68.5% N (3)
The next stage is the fuel combustion process similar to a diesel engine. Fuel is injected from the injector at the desired pressure and temperature inside the combustion chamber. Then, the diesel combustion process occurs, causing the pressure to increase and then decrease a second time. The entire combustion process generates products that are expelled through the exhaust valve. The pressure variations throughout the entire process inside the chamber are recorded by a piezo transducer pressure sensor. Based on this foundation, all the parameters including injection pressure, injection timing, injection duration, combustion pressure, and temperature of the chamber are recorded for evaluating the entire process of fuel mixture formation and combustion within the combustion chamber. The basic structure of the CVCC is illustrated in Figure 4 .
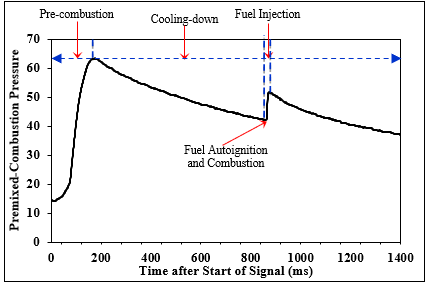
Historical pressure curve of two-stage combustion in the CVCC - simulated diesel condition.
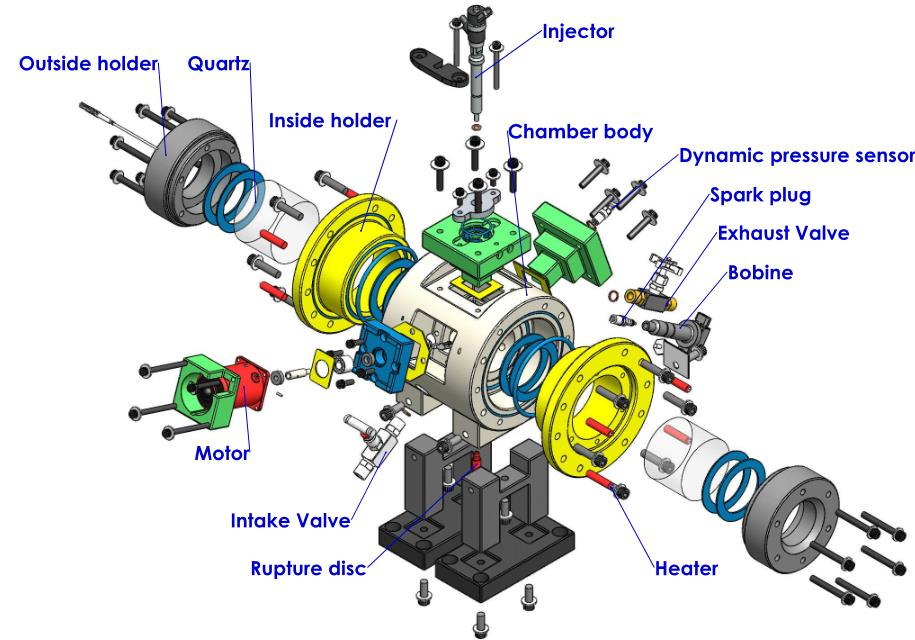
The exploded view of the main parts on CVCC.
EXPERIMENTAL CONDITIONS AND SET-UP
Structural simulation conditions
The structural analysis was performed by using the finite element method through the ANSYS software.
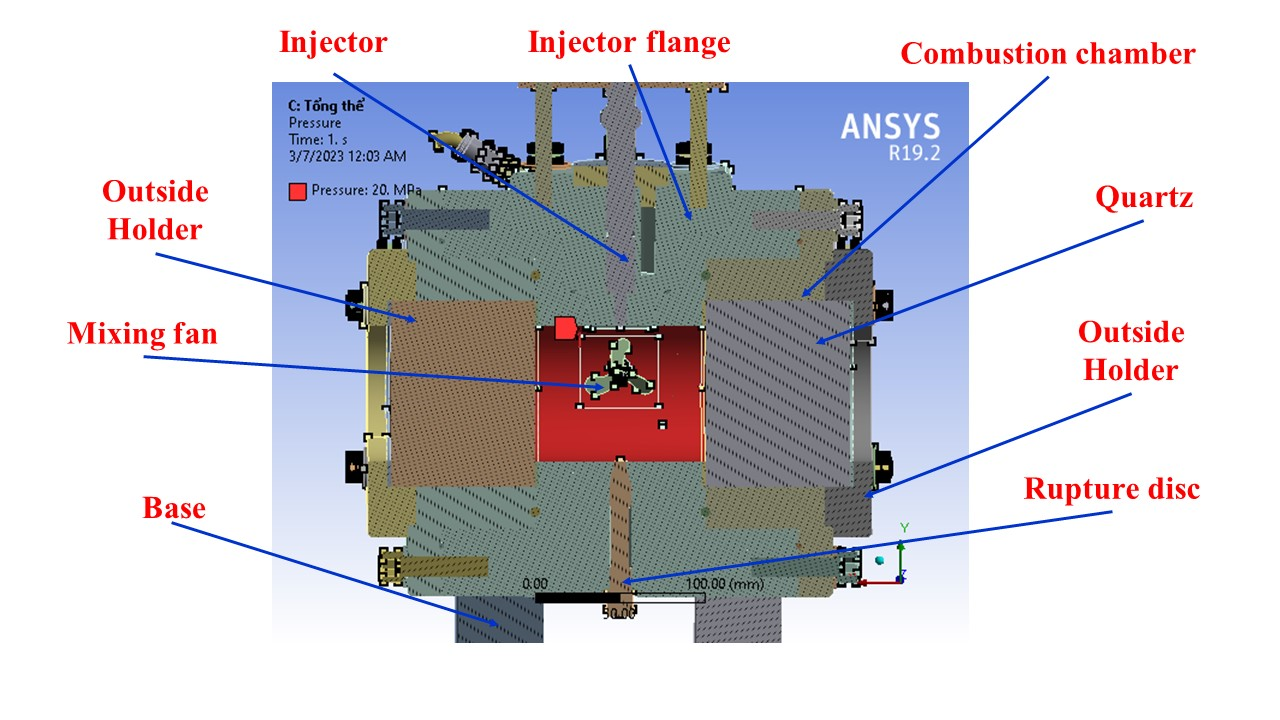
Set up input pressure for testing strength conditions.
Figure 5 illustrates the pressure distribution inside the simulated combustion chamber model in a steady-state environment. The combustion chamber body was fabricated by Inox 304 material with a yield strength limit of 207 MPa, capable of withstanding high temperatures ranging from 1674K to 1724K. The test pressure applied inward on the chamber walls reached a maximum of 100 bar and 200 bar, while the simulated structural temperature was set at 600K. For optical access, a quartz window with a compressive strength limit of 1100 MPa was used, exposed to the combustion process inside the chamber at pressures of 100 bar and 200 bar, and a temperature of 400K. The summarized simulation conditions are presented in Table 1 , and the material properties are listed in Table 2 .
Simulation conditions of CVCC.
|
Subject of structural simulation |
Chamber body |
Quartz |
|
Pressure simulation |
100 bar, 200 bar | |
|
Temperature |
600K |
400K |
|
Material |
Inox 403 |
Quartz |
Material characteristic parameters.
|
Parameters |
Material | |
|
Inox 304 |
Quartz | |
|
Mass density (kg/m3) |
7750 |
2203 |
|
Elastic modulus (GPa) |
193 |
71.3 |
|
Poisson’s ratio |
0.31 |
0.15 |
|
Yield strength (MPa) |
207 |
483 |
|
Compressive strength (MPa) |
586 |
1100 |
Experimental conditions of temperature distribution and leakage verification
CVCC leakage rate test
To ensure the desired pressure and temperature inside the combustion chamber after sparking ignition and observe the premixed combustion process, the leakage rate of the combustion chamber was tested with pressures ranging from 5 bar to 80 bar. The compressed Nitrogen (N) gas was introduced into the combustion chamber for 30 minutes. Table 3 summarizes the test conditions for determining the leakage rate of the combustion chamber.
Condition parameters of CVCC leakage rate
|
Types of gas |
Nitrogen (N2) |
|
Pressure investigated |
5 bar – 80 bar |
|
Duration |
10 minutes |
|
Times |
5 |
Temperature distribution test surrounding CVCC
The combustion chamber is heated to a high temperature to prevent water vapor condensation on the working surfaces and equipment inside the chamber. Additionally, the high temperature inside the wall of the combustion chamber facilitates the homogenization of the gas mixture and reduces heat loss to the surrounding environment, thereby ensuring more precise injection and combustion processes. The temperature distribution on the combustion chamber wall is investigated at eight different positions surrounding the CVCC combustion chamber, with tested heating temperatures of 60°C, 70°C, 80°C, 90°C, and 100°C. Each condition is observed for 60 minutes. Table 4 provides a summary of the experimental conditions for investigating the temperature distribution around the constant volume combustion chamber. Figure 6 illustrates the locations of the investigated regions.
Investigate conditions of temperature distribution
|
Number of survey positions |
Value |
Duration |
|
8 |
60°C, 70°C, 80°C, 90°C, 100°C |
60 minutes |
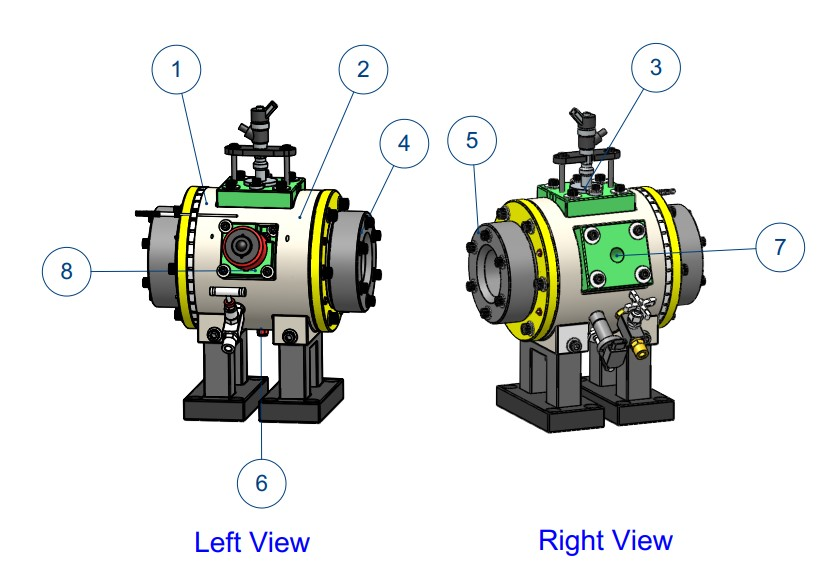
Measured point positions of temperature distributions.
The experimental setup for diesel combustion measurement
Besides the main combustion chamber, the CVCC consists of various external systems, as shown in Figure 7. The CVCC system includes the charge gas intake system, ignition system, heating system, gas stir fan system, fuel common rail injection system, control-indicating system, and data acquisition system. These systems are connected to the components mounted on the chamber to conduct combustion experiments. Figure 8 illustrates the fabricated CVCC based on the design. The main body of the combustion chamber is designed with a cylindrical shape, an internal diameter of 80mm, a thickness of 155mm, and a chamber volume of 546 cm. The observation of the combustion process inside the combustion chamber is carried out using the Schlieren optical method through two quartz windows with a diameter of 110mm and a thickness of 85mm, which are installed on opposite sides of the chamber. The quartz windows are protected by outer and inner covers and are tightly sealed into the chamber. The valve assembly consists of intake and exhaust valves used for gas intake and release. Additionally, a safety valve is installed below the chamber with a pressure limit of 170 bar to ensure the chamber operates within the allowable pressure range. The mixing fan, mounted on an inclined bracket and driven by a motor with a rotation speed of 3000 RPM, is responsible for homogenizing the gas mixture. To achieve an initial high temperature inside the chamber and prevent water vapor condensation on the quartz windows and the homogenized gas mixture, eight heaters are installed around the chamber wall.7 The ignition assembly, directly attached to the chamber, consists of a spark plug and coil connected to the ignition system, which generates an electrical spark to ignite the gas mixture. The fuel injector is mounted within the chamber through cooling water inside the bracket. Finally, the data acquisition system includes dynamic pressure sensors and temperature sensors. The dynamic pressure sensor mounted on the CVCC is connected to the amplification circuit and then transmits the signal to the oscilloscope. It collects pressure data within the chamber to monitor pressure variations during the experimental process.
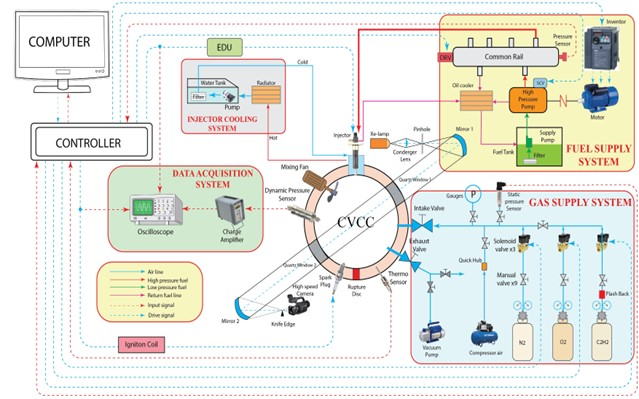
The schematic diagram for the operation system of CVCC
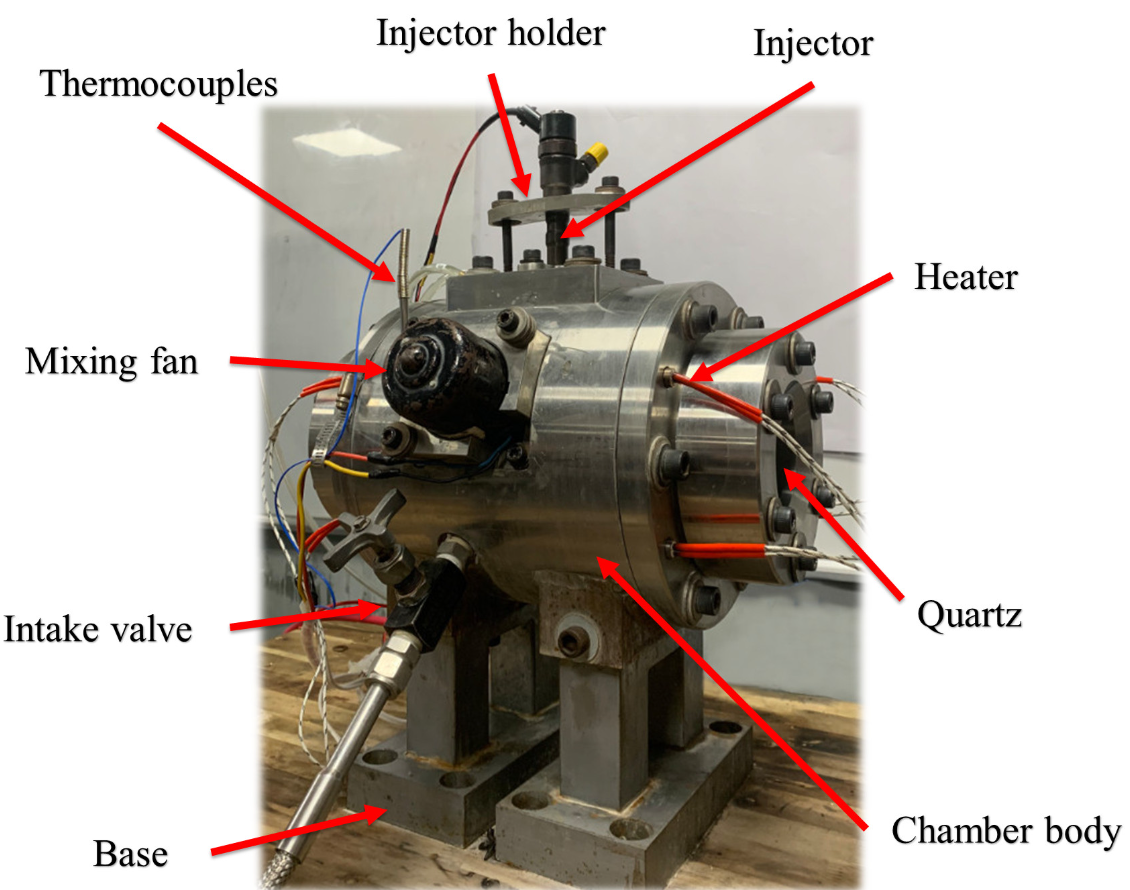
Photograph of part assembly on CVCC.
The combustion process in the constant volume combustion chamber (CVCC) is divided into two stages. The first stage is the pre-combustion phase, where a gas mixture is ignited. The gas mixture consists of CH, O, and N, with their percentages calculated accordingly. The desired percentage of O after the reaction is 21%. Following that is the stage where the fuel combustion process takes place. Diesel fuel is injected into the chamber through the injector at experimental conditions of injection pressure at 800 bar, 1000 bar, and 1200 bar, with an initial pressure of 42 bar. The experimental conditions for the combustion process in the constant volume combustion chamber are summarized in Table 5 .
Experimental conditions of the pre-combustion process and the diesel combustion process
|
Experiment Conditions |
The precombustion process |
The diesel combustion process |
|
Compositions of intake gas |
C2H2; O2; N2 | |
|
Percent O2 after the reaction |
21% | |
|
Premixed gas (bar) |
9-17 |
14 |
|
Fuel |
- |
Diesel |
|
Ambient pressure (bar) |
42 | |
|
Injection pressure (bar) |
800, 1000, 1200 | |
RESULTS AND DISCUSSION
Structural simulation results
The pressure impacts the chamber walls, where the combustion simulation process takes place inside the CVCC. Therefore, the results of the structural analysis also demonstrate the stress and deformation of the components primarily concentrated at the locations directly exposed to the working conditions of the constant volume combustion chamber. Figure 9 (a). illustrates the test results of the main chamber body, where it directly contacts the combustion pressure, and the location where the mixing fan is installed experiences the highest stress of 47.603 MPa at a pressure of 200 bar. Based on the material properties, the main chamber body is still capable of withstanding the operational stress with safety factors of 4.35 and 8.6 at pressures of 100 bar and 200 bar, respectively. The stress distribution on the optical window is shown in Figure 9 (b), concentrating primarily on where the quartz window is covered by an external cover. The quartz material has a brittle nature with a compressive strength limit of 1100 MPa. The stress primarily originates from the reaction force of the external cover acting on the outer surface of the optical window, with the maximum stress reaching 100.05 MPa at a safety factor of 11.09 for a pressure of 200 bar and 15 for a pressure of 100 bar.
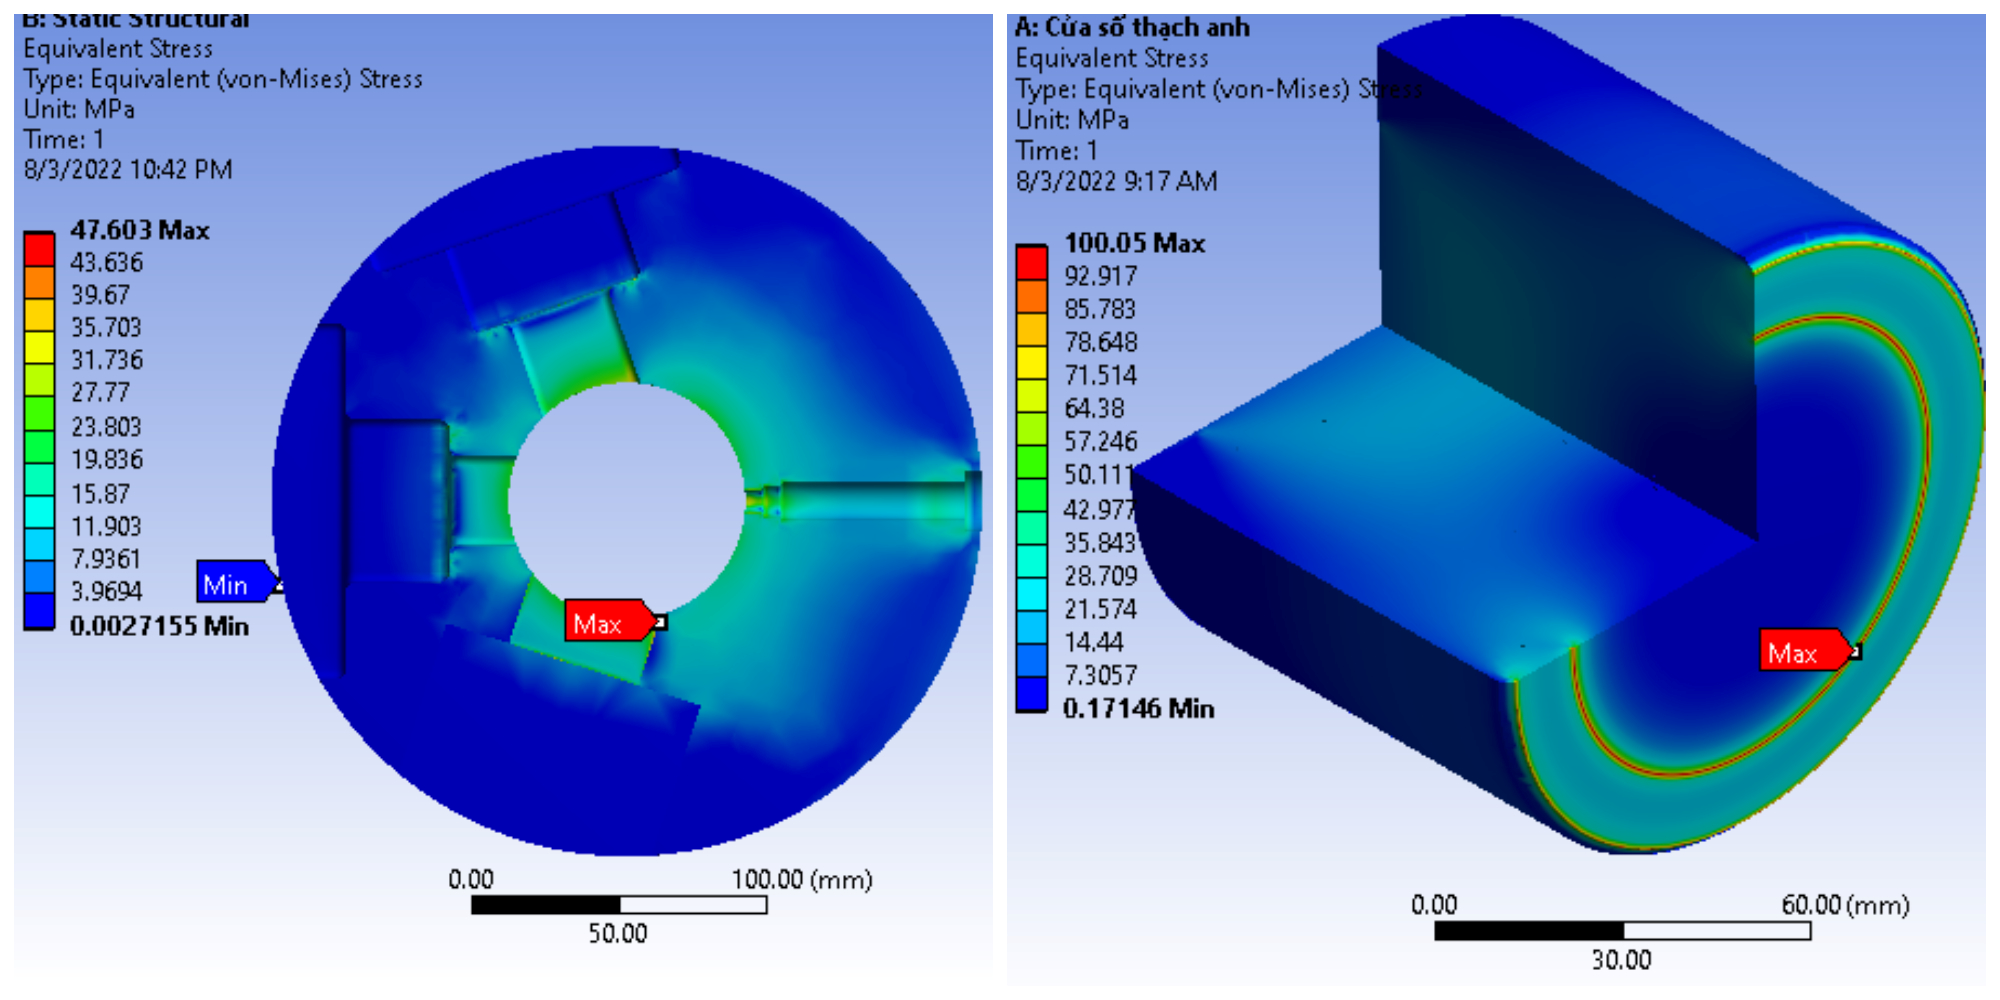
(a) The stress distribution of the chamber body; (b) The stress distribution of the optical window.
Evaluation of leakage rate and temperature distribution of the CVCC
Leakage rate of the CVCC
Figure 10 presents the leakage test results showing that at pressures ranging from 5 bar to 50 bar, the chamber does not experience any leakage. From 55 bar and above, signs of gas leakage start to appear, with the leakage rate gradually increasing. The leakage rate was recorded at 4.84 mbar/ms at an 80 bar pressure on average. It is evident that the combustion chamber remains leak-tight under mixed gas loading conditions, and the leakage rate is low even at high pressures, ensuring accurate gas mixture intake. The amount of gas escaping from the chamber is negligible compared to the pressure variations during the combustion process. As a result, the combustion chamber guarantees a real sealing performance to conduct the combustion process effectively in the constant volume combustion chamber (CVCC).
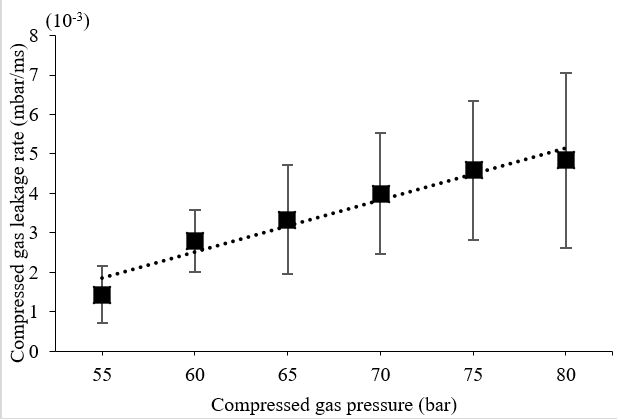
The leakage rate of CVCC.
Temperature distribution of the CVCC
Figure 11 illustrates the temperature distribution surrounding the CVCC when heated to 60C, as measured using the TIT-202 Thermal Imager at 8 specified locations, as shown in Figure 11.
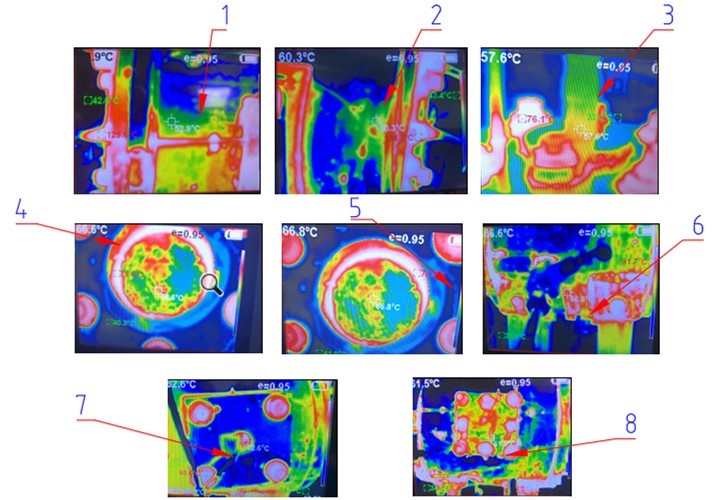
Investigation of temperature distribution of the CVCC.
Figure 12 presents the average temperature results for various heating conditions ranging from 60C to 100C. The results demonstrate uniform temperature distribution at the surveyed positions, with a temperature deviation of ±5C between the locations. Except for the nozzle installation point (position 3) which is cooled by the circulating coolant, resulting in a lower temperature compared to other points due to the nozzle assembly.
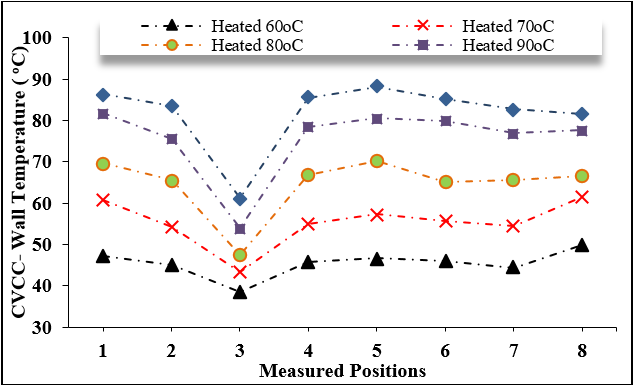
Temperature survey positions.
Pre-combustion test
Figure 13 represents the results of 20 pre-combustion process experiments with the intake gas mixture conditions set at 14 bar, 21% O, and preheated to 100˚C, as chosen from the conditions listed in Table 4. After the ignition process initiated by the spark plug, the combustion mixture rapidly increased the pressure. The results indicate that the pressure variation obtained from the 20 experimental runs is quite similar, with an average maximum pressure of 71.29 bar and very low peak pressure deviation, within approximately 1%. During the cooling-down phase, as illustrated in Figure 3 , the pressure in the CVCC reaches the desired ambient pressure of 42 bar, and the delay time from the ignition signal is determined from the pressure history curve. The average deviation of this period over the 20 experimental runs is approximately 4%. These findings indicate that the combustion chamber can be effectively simulated for the pre-combustion process, creating an ambient pressure suitable for simulating the diesel engine combustion conditions.
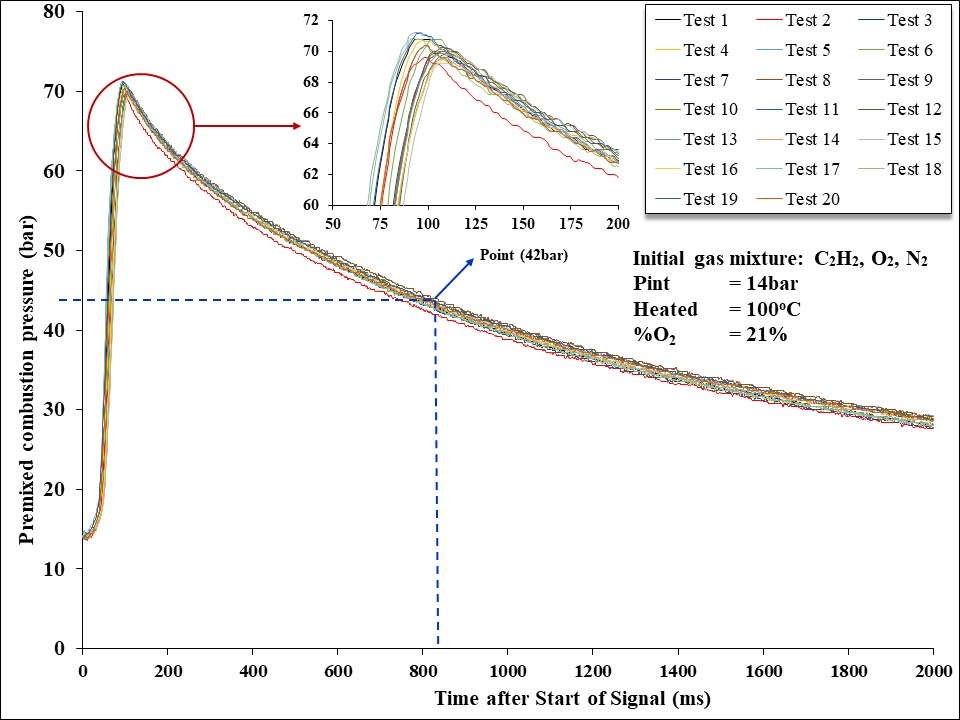
The premixed-combustion pressure history curves.
Figure 14 presents the analysis of the peak pressure achieved during the pre-combustion phase and the average time required for the cooling-down phase to reach the desired ambient pressure of 42 bar. The peak pressure value is proportional to the initial intake gas pressure and the time taken to reach the desired ambient pressure at 42 bar. The smallest peak pressure recorded is 46.54 bar and the largest is 87 bar, respectively, for initial intake gas pressures of 9 bar and 17 bar. The peak pressure difference among the 20 experimental runs at the same intake gas pressure level is relatively low, at around 2%. This demonstrates the stability of the pre-combustion process when varying the intake gas pressure under different conditions.
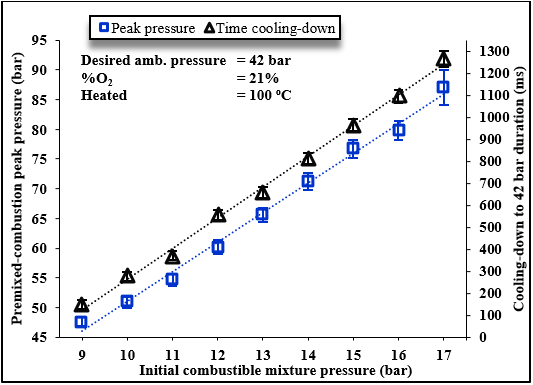
Analytical diagram of the peak pressure and cooling-down phase.
Diesel combustion test
Figure 15 and Figure 16 illustrate the pressure variation and heat release rate (HRR) during the combustion process of diesel fuel at an injection pressure of 42 bar, 21% oxygen concentration, and a fuel injection duration of 2.0 ms. The test is performed at three different fuel injection pressures: 800 bar, 1000 bar, and 1200 bar. From Figure 15 , it’s evident that the analysis system shows a direct proportionality between the combustion pressure and the HRR concerning the fuel injection pressure. Specifically, the combustion pressure increase is 52 bar, 52.5 bar, and 53.69 bar respectively for the fuel injection pressures of 800 bar, 1000 bar, and 1200 bar. This trend is consistent with other studies conducted on the CVCC combustion chamber24, 25 and can be attributed to the rising fuel injection pressure, which enhances the injection rate and reduces the fuel droplet size, thus leading to improved combustion efficiency.
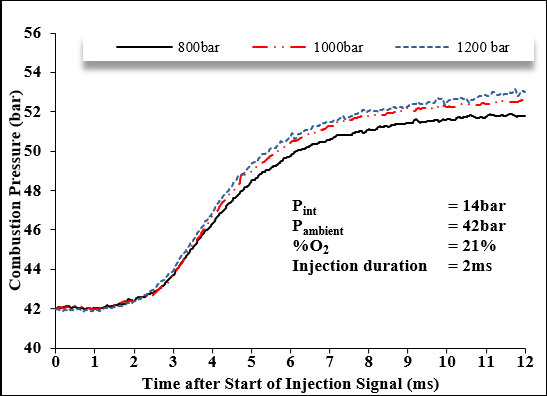
Pressure variation at diesel combustion process.
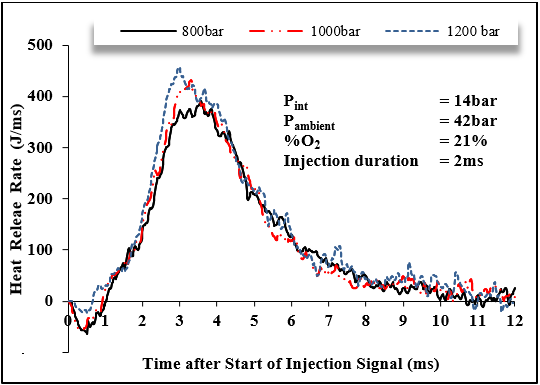
Heat release rate in CVCC.
CONCLUSIONS
This paper discusses the method used to design, simulate, and analyze the structural strength of CVCC combustion chambers. Furthermore, experiments are performed to measure the characteristics of pre-combustion and diesel fuel combustion in the CVCC system. These experiments aim to evaluate the stability and high applicability of the system in investigating the diesel fuel combustion process. The study's conclusions are summarized as follows:
(1) The system ensures safety, leak-proofing, and meets technical standards during the structural durability testing with a safety factor of 4.35 and 8.6 at pressures of 100 bar and 200 bar, respectively.
(2) The CVCC is capable of conducting various pre-combustion experiments with various initial pressure values to replicate conditions similar to the end-of-compression phase in a diesel engine with an accuracy of 1%.
(3) The fuel injection tests performed under conditions of temperature and pressure equivalent to the end-of-compression phase in a diesel engine within the CVCC yield results consistent with other research trends when varying operational parameters (base pressure, fuel injection pressure, O concentration).
ABBREVIATIONS
CVCC: Constant Volume Combustion Chamber
EGR: Exhaust gas recirculation
ORE: Optical Research Engines
RCEM: Rapid Compression and Expansion Machine
CPFR: Constant Pressure Flow Rig
CVHC: Constant Volume Hot Cell
C: Flow coefficient
ρ: Air density
ρ: Fuel density
P: Different pressure between injection and chamber pressure
t: Time after injection
d : Nozzle diameter
CONFLICT OF INTEREST
The author(s) declare(s) that there is no conflict of interest regarding the publication of this paper.
AUTHORS’ CONTRIBUTION
All authors have accepted responsibility for the entire content of this manuscript and approved its submission. Conceptualization, Methodology, and Writing (review & editing), as well as project administration, were performed by Vo Tan Chau. The first draft of the manuscript was written by Ngo Vo Truong Giang and Doan Phuoc Dong. They are also the members who participated in conducting experiments.
ACKNOWLEDGMENT
We thank the support of time and facilities from the Industrial University of Ho Chi Minh City (IUH) and Ho Chi Minh City University of Technology (HCMUT) for this study. This work was performed using mainly the equipment in the Faculty of Automotive Engineering Technology, Industrial University of Ho Chi Minh City, and the assistance of others and students.