


Frying of sliced shallot (Allium ascalonium): Product quality and kinetic models at different frying temperatures: Slices shallot frying

- Department of Food Technology, Faculty of Chemical Engineering, Ho Chi Minh City University of Technology (HCMUT), 268 Ly Thuong Kiet Street, District 10, Ho Chi Minh City, Vietnam
- Vietnam National University Ho Chi Minh City, Linh Trung Ward, Thu Duc District, Ho Chi Minh City, Vietnam
Abstract
Shallot (Allium ascalonium) is a popular ingredient in Asian cuisine including Vietnam. Fried shallot is widely used in the preparation of various traditional meals. However, the kinetic models of sliced shallot frying process have not been considered. In this study, the effects of frying temperature on changes in moisture content, oil uptake, hardness and instrumental color of sliced shallot were examined and their kinetic models were investigated. Increase in frying temperature from 130 to 150oC accelerated the moisture loss and oil uptake content of the shallot in order to achieve the equilibrium values within a shorter frying time. At the frying temperature of 130, 140 and 150oC, the final moisture content of fried shallot was 2.60 ± 0.36, 2.92 ± 0.35 and 1.64 ± 0.43 g/100g, while the oil uptake content was 47.26 ± 1.42, 46.36 ± 1.45 and 46.07 ± 0.40 g/100g dry matter, respectively. During the first step of frying, the hardness of shallot was slightly reduced but it was greatly enhanced and achieved maximum at the end of the process. In addition, the darkness level of fried shallot witnessed the same upward trend during frying. Based on the experimental data, the appropriate kinetic models for changes in moisture content, oil uptake level, hardness and color values of sliced shallot during the frying process at different temperatures were being developed with the correlation (R2) larger than 0.95. Page model appeared to be the most appropriate for moisture loss and oil uptake whilst the three models including Newton model, Wang & Singh model, Third-order Polynomial model were shown to be suitable for changes in hardness of fried shallot. However, the changes in color values only fit the Third-order Polynomial model. In conclusion, this study could predict the effects of temperature and time on the shallot quality during the frying process.
INTRODUCTION
Shallot (Allium ascalonium) is a flavor-building vegetable in the allium family. According to FAO data 1, the total production of onions and shallots is over 4 million tons per year with a total cultivated area of over 200,000 hectares. In particular, shallot is mainly distributed in Asia and Africa, and it is widely used in Asian cuisine.
Frying is one of the conventional cooking processes to obtain desirable texture and color for many different types of food. Using oil as a heat transfer agent can help create a cooking temperature that exceeds the boiling point of water inside food ingredients2. As the frying process carries on, both heat and mass transfer happen at the same time. In this case, oil is not only a heat transfer agent but is also absorbed into the food 3. Besides, high temperatures used in frying can cause changes in food color due to the browning process4.
Previous studies on the effects of frying temperature and time on food qualities reveal that the higher the frying temperature, the greater the amount of oil absorbed into the product 4, 5, 6. The oil distribution in a fried food product is related to its initial moisture distribution7. In addition, changes in fried food texture in respect to frying temperature were also reported8.
Sliced fried shallot is a well-known ingredient in Asian cuisine. This product is commercially available in the market of Southeast Asian countries. Nevertheless, the kinetic models of changes in shallot during the frying process have not been considered in the literature. The purpose of this paper is to (i) investigate the effects of frying temperature and time on changes in moisture content, oil uptake level, color and hardness values of the product; (ii) select the kinetic models for the changes in moisture content, oil uptake, color and hardness values during the frying process.
MATERIALS AND METHODS
Materials
Fresh shallot (Allium ascalonium) was procured from a local market of Ho Chi Minh City, Vietnam. The shallot was peeled, sliced into approximately 2,0 0,2 mm thickness. Soybean oil was originated from Cai Lan Oils and Fats Industries Company, (Ho Chi Minh City, Vietnam). Analytical chemicals were originated from VN Chemsol, Ho Chi Minh City, Vietnam.
Sliced shallot frying
Approximately 200 grams of freshly sliced shallot was being deep-fried in 400 grams of soybean oil at three isothermal temperatures (130℃, 140℃, and 150℃) until the fried slices reached a dark-brown color. During the frying process, 10 grams of shallot sampling was taken out every 30 seconds in order to determine changes in moisture content, oil uptake, color and hardness. Oil was being changed after each frying batch.
Moisture content analysis
The moisture content was estimated by using AOAC method 984.25. About 3 grams of fried shallot was being dried in an oven at 105℃ to constant mass in order to calculate moisture loss.
The term moisture ratio (MR), a dimensionless factor, was used to describe the frying kinetics of moisture loss during the frying process. It is defined as the ratio between the moisture loss at frying time t and the total moisture loss when the equilibrium moisture content of fried product was achieved.
Whereas, is the moisture content of product at frying time t; is the initial moisture content of product and is the equilibrium moisture content of product.
Oil uptake analysis
Oil content was determined by Soxhlet extraction. About 3 grams of fried shallot was being air-dried in an oven at 105℃ to constant mass and the oil was then extracted with diethyl ether for 5 hours.
The term oil ratio (OR), a dimensionless factor, was used to present the frying kinetics of oil uptake during the frying process. It is defined as the ratio between oil uptake at frying time t and the total oil uptake when the equilibrium oil content of fried product was achieved.
Whereas, L is the amount of oil absorbed into product at time t; L is the initial lipid content of product and L is the equilibrium oil content of product.
Hardness analysis
The hardness of fried shallot was measured by Texture Profile Analysis (TPA) using a texture analyzer (TA-XT Plus, Stable Micro Systems, UK) equipped with a 5 kg load cell. The probe used had a diameter of 3.5 mm and was inserted to a depth of 10 mm. Both pre-test and post-test speeds were set to 10 mm/s, and the test speed was set to 1 mm/s. The resulting data were analyzed using Exponent Connect Lite 7.0 Software.
Instrumental color analysis
The color values of fried shallot were determined by using the Konica Minolta spectrophotometer (CM – 3700A model, Konica Minolta Inc, Osaka, Japan). Color data were presented by CIE (lightness), (redness), (yellowness) coordinates. The total color difference () was calculated as follows:
Where , and are the color values of the sample at start of the frying; L, a and b are the color values of the fried sample.
Statistical analysis
All fried samples were conducted at least three times. Each fried sample was analyzed three times and average values were reported while statistically significant was accepted at p < 0.05. The best fitting model was performed by using the least squares method for nonlinear regression analysis using RStudio software 2022.12.0 for Windows (Posit, PBC). One-way analysis of variance (ANOVA) was performed by using the software Statgraphics Centurion XV (Manugistics Inc., Rockville, MD, USA).
RESULTS AND DISCUSSION
Moisture content of shallot slices during frying time at different temperatures
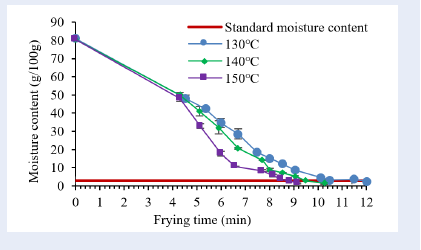
Changes in the moisture content of sliced shallots during the deep-frying process are shown in Figure 1. Starting at 80.49 ± 0.38 g/100g shallot, the moisture content of the shallot decreased as the frying proceeded. During the first four minutes, the decreased level of moisture content of shallot was nearly similar at the three frying temperatures. The increase in frying temperature from 130℃ to 150℃ greatly enhanced the moisture loss from the 4 to the 9 minute. Then, the moisture loss slowed down until the moisture content of shallot reached equilibrium values, which were 2.60 ± 0.37 g/100g at 130℃, 2.92 ± 0.35 g/100g at 140℃ and 1.64 ± 0.43 g/100g at 150℃. According to East African Food Standards, the final moisture content of deep-fried products, such as potato crisps must be below 5g/100g9. Therefore, these equilibrium values of fried shallot’s moisture content at different frying temperatures is acceptable to obtain an extended shelf life for the product. Moreover, the higher temperature during the deep-frying process requires less time to reach the equilibrium values of moisture content in shallot, which were 12 ± 0.25 min, 9.5 ± 0.25 min, and 9.15 ± 0.25 min at 130℃, 140℃ and 150℃, respectively.

Effects of frying temperature on moisture loss of sliced shallot
Kinetic models for the moisture loss of shallot during frying
|
Model |
Equations |
Frying temperatures (℃) |
Model constants |
R2 |
Reference |
|
Newton |
|
130 |
|
0.9020 |
|
|
140 |
|
0.8863 | |||
|
150 |
|
0.8875 | |||
|
Page |
|
130 |
|
0.9965 |
|
|
140 |
|
0.9969 | |||
|
150 |
|
0.9965 | |||
|
Henderson & Pabis |
|
130 |
|
0.8842 |
|
|
140 |
|
0.8788 | |||
|
150 |
|
0.8767 | |||
|
Logarithmic |
|
130 |
|
0.2911 |
|
|
140 |
|
0.3836 | |||
|
150 |
|
0.3103 | |||
|
Midilli et al. |
|
130 |
|
0.9892 |
|
|
140 |
|
0.9830 | |||
|
150 |
|
0.9644 | |||
|
Wang & Singh |
|
130 |
|
0.9785 |
|
|
140 |
|
0.9804 | |||
|
150 |
|
0.9634 |
Kinetic models for the oil absorption in sliced shallot during frying
|
Model |
Equations |
Frying temperatures (℃) |
Model constants |
R2 |
Reference |
|
Newton |
|
130 |
|
0.9063 |
|
|
140 |
|
0.8757 | |||
|
150 |
|
0.8939 | |||
|
Page |
|
130 |
|
0.9925 |
|
|
140 |
|
0.9930 | |||
|
150 |
|
0.9803 | |||
|
Henderson & Pabis |
|
130 |
|
0.9024 |
|
|
140 |
|
0.8722 | |||
|
150 |
|
0.8905 | |||
|
Wang & Singh |
|
130 |
|
0.9781 |
|
|
140 |
|
0.9714 | |||
|
150 |
|
0.9552 |
Kinetic models for moisture loss of shallot being fried at 130℃, 140℃ and 150℃
The data recorded from the experiment were tested with different models by the RStudio program. Six mathematical models built for the changes in moisture content during the frying process at different temperatures are shown in Table 1. With the experimental data, the Newton, Henderson & Pabis, and Logarithmic models found to be unsuitable as the regression coefficients (R) of these models were smaller than 0.95. The three models with R greater than 0.95 for the three temperatures were the Page, Midilli, and Wang & Singh models. However, the Page model appeared to be the most appropriate model with the highest R of 0.9965, 0.9969, and 0.9965 at 130℃, 140℃, and 150℃, respectively. A similar model was also reported by Ngan et al. (2013) when the drying kinetics for moisture loss in fried shallot was investigated 16.
Oil uptake of shallot during frying time at different temperatures
Changes in oil uptake during the deep-frying process are presented in Figure 2. Overall, the oil content of shallot increased as the frying proceeded. Starting at 0.82 ± 0.07 g/100g dry matter, the oil content of the shallot gradually increased. The oil uptake of sliced shallot was nearly similar at the first 6 min of the frying. Then the oil uptake was faster for the shallot sample fried at the higher temperature. Finally, the equilibrium value was 47.26 ± 1.42 g/100g dry matter at 130°C and 46.07 ± 0.40 g/100g dry matter at 150℃. Oil uptake of shallot being fried for 12 ± 0.25 min at 130℃, 9.5 ± 0.25 min at 140℃ and 8.85 ± 0.25 min at 150℃ were 47.26 ± 1.42 g/100g dry matter, 46.36 ± 1.45 g/100g dry matter and 45.88 ± 0.59 g/100g dry matter, respectively.
Kinetic models for oil uptake of shallot being fried at 130℃, 140℃ and 150℃
Four mathematical models based on the obtained experimental data at different temperatures are visualized in Table 2. It can be noted that the Newton and Henderson & Pabis model were found inappropriate as the regression coefficients (R) of these models were smaller than 0.95. With R greater than 0.95 for the three temperatures, the Page model and the Wang & Singh model were both suitable. However, the Page model showed great aptness for having the highest R of 0.9925, 0.9933, and 0.9803 at 130℃, 140℃, and 150℃, respectively. According to Krokida et al. (2000)4, the Arrhenius model was used for kinetic calculations of oil uptake during the french fries frying. This kinetic model was also used for similar fried products including chicken nuggets17 and Gethi strips18.

Effects of frying temperature on oil uptake of shallot
Changes in texture of fried shallot during frying time at different temperatures
Changes in hardness during the deep-frying process are demonstrated in Figure 3. The initial hardness value was 8.1 1.2 N and increased to about 3.5 0.8 N in 4 min for all samples. The increase in hardness was probably due to the reduced moisture content of shallot19. The hardness value of samples fried at 150C was 29.3 0.9 N in 8.85 0.25 min, at 140C was 28.5 2.0 N in 10.25 0.25 min, and at 150C was 29.3 2.0 N in 12.00 0.25 min. A similar observation was reported in the beginning stage of deep-fat frying yellow fleshed Cassava Chips20.

Effects of frying temperature on the hardness of shallot slices
Kinetic models for hardness of shallot being fried at 130℃, 140℃ and 150℃
Three mathematical models based on the experimental data are shown in Table 3. All of these models were found to be suitable as the regression coefficients (R) of these models were greater than 0.95. According to Kumar et al. (2006) 19, the kinetic model used for calculating the hardness of Gulabjamunballs (an Indian milk sweet) followed the rules of zero-order kinetics. However, this model was found unfit with the data of shallot frying.
Kinetic models for the fried shallot hardness
|
Model |
Equations |
Frying temperatures (℃) |
Model constants |
R2 |
Reference |
|
Newton |
|
130 |
|
0.9666 |
|
|
140 |
|
0.9803 | |||
|
150 |
|
0.9619 | |||
|
Wang & Singh |
|
130 |
|
0.9823 |
|
|
140 |
|
0.9825 | |||
|
150 |
|
0.9322 | |||
|
Third-order Polynomial |
|
130 |
|
0.9925 |
|
|
140 |
|
0.9881 | |||
|
150 |
|
0.9868 |
Kinetic Third-order Polynomial models for the surface color values of fried shallot
|
Equations |
Frying temperatures (℃) |
Model constants |
R2 |
|
|
130 |
|
0.9925 |
|
140 |
|
0.9881 | |
|
150 |
|
0.9868 | |
|
|
130 |
|
0.9925 |
|
140 |
|
0.9881 | |
|
150 |
|
0.9868 | |
|
|
130 |
|
0.9925 |
|
140 |
|
0.9881 | |
|
150 |
|
0.9868 | |
|
|
130 |
|
0.9925 |
|
140 |
|
0.9881 | |
|
150 |
|
0.9868 |
Color changes

Effects of frying temperature on L*, a*, b* and ΔE values during frying time
Effect of frying temperature on the surface color changes (L, a and b) of the shallot slices are presented in Figure 4. The final value of L, a, b and ΔE were recorded at 10.50 ± 0.25 minutes, 9.50 ± 0.25 minutes, 8.85 ± 0.25 minutes for 130C, 140C, and 150C, respectively. The lightness value (L) decreased from 63.2 ± 1.2 to 38.8 ± 0.4 at 130C, 40.0 ± 1.0 at 140C, 39.0 ± 1.0 at 150C. The redness (a) increased from -1.9 ± 0.2 to 21.5 ± 1.1 at 130C, 22.5 ± 2.2 at 140C, 29.0 ± 1.5 at 150C while the yellowness (b) increased from 11.0 ± 1.1 to 40.1 ± 1.7 at 130C, 41.3 ± 0.8 at 140C, 43.2 ± 1.4 at 150C. In addition, the color difference of shallot at the start and the end of frying was greater as the frying temperature was higher: ΔE increased from 44.1 ± 1.4 at 130C to 50.9 ± 2.7 at 150C. The increase in the color difference can be attributed to the high temperature and low moisture, which caused the Maillard reaction and the caramelization of sugars. Furthermore, a value of ∆E > 3.50 also represents a color difference that can be recognized with the naked eye22. The color change of the sample at 130oC can be observed after frying for about 5.35 ± 0.25 minutes with ΔE of 5.16 ± 0.76. Meanwhile, the color change of samples observed at 140C and 150C was earlier, after frying about 4.30 ± 0.25 minutes, with ΔE values for 140C and 150C being 7.33 ± 1.32 and 6.42 ± 0.62, respectively.
Kinetic models for color changes of shallot being fried at 130℃, 140℃ and 150℃
The color values (L, a and b) are modeled using polynomial equations of third order with R values given at Table 4. The experimental data were well fit to the selected model. Similar model was previously used to describe the kinetics for color change during the frying of slices onion 21.
CONCLUSION
The quality of fried shallots was dependent on frying temperature and time. As the frying temperature increased from 130°C to 150°C, the moisture content of shallot decreased faster and achieved the required level for a shorter frying period of time. On the contrary, as the temperature accelerated, the oil uptake in shallot reached the equilibrium value faster. Both Page and Wang & Singh models were appropriate for kinetic calculation of changes in moisture content and oil uptake level. The hardness of shallot gradually enhanced during the frying and the Newton, Wang & Singh, and Third-order polynomial models were suitable to predict the change in shallot hardness during the frying. Increased frying temperature and time of sliced shallot resulted in darker color and the Third-order polynomial model was appropriate to estimate color changes of the product.
ACKNOWLEDGMENT
This research is funded by Ho Chi Minh City University of Technology – VNU-HCM under grant number SVKSTN-2022-KTHH-01.
We acknowledge the support of time and facilities from Ho Chi Minh City University of Technology (HCMUT), VNU-HCM for this study.
COMPETING INTERESTS
The authors declare that they have no competing interests.
AUTHORS’ CONTRIBUTIONS
Le Hoang Minh Quang, Tran Ngoc Hong Anh, Nguyen Khanh Ha and Nguyen Duy Hoang are doing experiment and writing this study. Nguyen Khanh Ha is responsible for correcting the English and format of this manuscript. Le Hoang Minh Quang is responsible for analyzing data. Tran Thi Thu Tra is in charge of analyzing texture data. Le Van Viet Man instructs all the members, gives advice and corrects all of the other issues that this research comes up with.