


Evaluating the effect of shear connection degree and shear connector shape on the bending behavior of steel-concrete composite beam
- Ho Chi Minh City University of Technology, Vietnam National University of Ho Chi Minh City
Abstract
The steel-concrete composite beams are created from the steel girder, the concrete slab, the shear connectors, and transverse reinforcement. The shear connectors play an important role in incorporating the steel girder and the concrete slab working together as a unity. The existence of the shear connectors will restrain the relative slip between the steel girder and the concrete slab. This enhances the load capacity and reduces the vertical deflection of the steel-concrete composite beams. The experimental study was carried out on three steel-concrete composite beams using perfobond shear connectors to investigate the effect of the shear connection degree and shape on the bending behavior of three steel-concrete composite beams. These steel-concrete composite beams had different number of shear connectors and shapes. The parameters evaluated here included the load capacity and the vertical deflection of composite beams. The shear capacity of perfobond shear connector was obtained from push-out tests. The load capacity of steel-concrete composite beam with full shear connection degree and partial shear degree were also determined by the prediction formula to evaluate the reliability of the experiment.
INTRODUCTION
The steel-concrete composite beams using perfobond shear connectors have been widely studied around the world. This shear connector has been considered a popular connector in the future. The load capacity of perfobond shear connectors has been obtained from push-out tests1, 2, 3, 4, 5, 6, 7, 8, 9, 10, 11 and then some authors have based on their data to develop into prediction formula2. Some authors: P.C.G. da S. Vellasco, L. F. Costa-Neves, et al. focused on studying T-perfobond shear connectors 12, 13, 14, 15 to enhance the mechanical behavior of this shear connector. Kun-Soo Kim, et al studied Y-perfobond subjected to cyclic loading to verify the effect of cyclic behavior on shear connection using stubby Y-type perfobond rib shear connectors16. All studies were carried out on small specimens with push-out tests. These experimental studies evaluated the effect of parameters on the mechanical behavior of perfobond shear connectors. The studied parameters included the compressive strength of the concrete, the thickness of the concrete slab, the dimensions of perfobond shear connector, the transverse reinforcement passing through the holes, and the hole diameter. The concrete used for tests was normal, lightweight, and high-strength concrete. The push-out tests for small specimens mainly investigate the load capacity of perfobond shear connectors, the relative slip between the steel girder and the concrete slab, and the failure modes of specimens. Some authors carried out a large-scale specimen to investigate the bending behavior of steel-concrete composite beams. E.G. Oguejiofor and M.U. Hosain tested six full-scale beams to evaluate the effect of the number of perfobond shear connectors, and the number of transverse reinforcements passing through the holes on the bending behavior of the steel-concrete composite beam 17. The hole of perfobond shear connector in this study had the shape of a circle. Gaetano Manfredi theoretically studied the ductility of composite beams under negative bending 18. The author used a refined model to the influence of the properties of reinforcing steel on the rotational capacity of composite beams under negative bending and validated with experimental tests. The shear connectors used in this study were stud connectors. Jianguo Nie established a mechanics model based on elastic theory to investigate the stiffness of composite beams in negative bending regions by considering slips at the steel beam–concrete slab interface and concrete–reinforcement interface19. These results were validated to three composite beams with profiled sheeting under negative bending. G. Vasdravellis investigated the behavior of Six full-scale steel–concrete composite beams using stud shear connectors subjected to the combined effects of negative bending and axial compression 20. In this study, three large-scale steel-concrete composite beams were carried out to investigate the effect of the shear connection degree and the shape of the shear connector on the bending behavior of the steel-concrete composite beams. Perfobond shear connector was used to prevent the relative slip between the steel girder and the concrete slab. Perfobond has the shape of ℧ open holes to place the transverse reinforcement passing through the holes easily.
MATERIALS
The steel-concrete composite beams are created from the steel girder, the concrete slab, the shear connectors, and reinforcements. These components must be determined the mechanical characteristics before conducting bending tests.
Concrete
Concrete used in steel-concrete composite beams was M350. The aggregate gradation is shown in Table 1. The concrete was cured in 28 days and tested in compliance with TCVN 3118-1993 21. The concrete compressive strength test was carried out at the time of the bending test. The test results of concrete compressive strength are shown in Table 2.
The aggregate gradation for 1 m3 concrete
|
Material component |
Unit |
Quantity |
|
Holcim cement PCB40 PowerS |
kg |
330 |
|
Bank sand |
kg |
495 |
|
Crushed sand |
kg |
335 |
|
Stone |
kg |
1115 |
|
Water |
littre |
165 |
|
Addition agent BASF Sky 8735 |
kg |
3.3 |
Mechanical characteristics of concrete
|
Dimensions (mm) |
Failure load (kN) |
Compressive strength (MPa) |
|
150×150×150 |
769.5 |
34.2 |
|
150×150×150 |
866.3 |
38.5 |
|
150×150×150 |
843.8 |
37.5 |
|
150×150×150 |
855.0 |
38.0 |
|
150×150×150 |
823.5 |
36.6 |
|
150×150×150 |
792.0 |
35.2 |
|
Average value |
824.9 |
36.7 |
Plate, hot-rolled steel, reinforcement
The test result of steel is presented in Table 3.
The test result of the steel
|
Specimen |
Reinf. steel |
Plate steel |
Hot-rolled steel |
|
Yield strength fy (MPa) |
347 |
320 |
284 |
|
Ultimate strength fu (MPa) |
488 |
425 |
389 |
|
Elastic modulus E (MPa) |
200×103 |
200×103 |
200×103 |
EXPERIMENT PROGRAM
Specimen
The main components of steel-concrete composite beams consist of a hot-rolled steel girder, concrete slab, perfobond shear connectors, and transverse reinforcements passing through the perfobond holes. The steel girder was hot-rolled steel of I-194×150×6×9. The perfobond shear connectors had a thickness of 8 mm, and a shape ℧ with an area of 4490 mm. The perfobond connectors were welded continuously along the steel girder length. The hot-rolled steel used CT3, and the concrete slab had a thickness of 100 mm, as shown in Figure 1. The number of perfobond shear connectors in beams was different to evaluate the effect of shear connection degree on the bending behavior of the steel-concrete composite beams. The number of perfobond shear connectors of beam 1, beam 2, and beam 3 is twenty, fourteen, and ten shear connectors, respectively. Among three steel-concrete composite beams, beam 1 and beam 3 have identical shear connector shapes and are different from the shear connector of beam 2. The capacity of each perfobond shear connector was P = 141.42 kN, this value was observed by the push-out test of a small specimen. There were two reinforcements of 10 mm in diameter passing through the perfobond holes. The cross-section of steel-concrete composite beams is shown in Figure 2. The parameters of steel-concrete composite beams are presented in Table 4. Figure 3 illustrates the image of a steel-concrete composite beam before concreting.
The parameters of composite beams
|
Detail |
Reinf. steel |
Plate steel |
Hot-rolled steel |
|
Yield strength fy (MPa) |
347 |
320 |
284 |
|
Ultimate strength fu (MPa) |
488 |
425 |
389 |
|
Elastic modulus E (MPa) |
200×103 |
200×103 |
200×103 |

Steel-concrete composite beams

Cross section of steel-concrete composite beam

Steel-concrete composite beam before concreting

Model of test
Test setup
Four-point bending model was used to observe the bending behavior of the steel-concrete composite beams, as shown in Figure 4. The load cell with a load level of 2000 kN was used for the bending test. The load was transferred through a steel beam. Linear Variable Displacement Transducers (LVDT) 1, 2, and 3 were used to measure vertical deflection along steel girder length, as shown in Figure 5. LVDT 4, 5, 6, and 7 were used to measure the relative slip between the concrete slab and the steel girder. Strain gauges were used to measure the strain of the concrete slab and the steel girder during loading. Figure 6 illustrates the incremental loading process. The applied load was divided into three phrases:
Phase 1: Increasing load from 0 to 40% failure load (P), and then repeating 2 times.
Phase 2: Increasing load from 10% P to 40% P, and then repeat 25 times. This stage is to eliminate the adhesive force, friction, and residual strain of testing.
Phase 3: After ending phase 2, increase load from 10% P to failure load, continue increasing load until the load remains 90% Pmax, and stop testing.

LVDT1, 2, and 3 attached to measure the vertical deflection of the composite beam

The incremental loading
TEST RESULTS, ANALYSIS, AND DISCUSS
The capacities and the vertical deflections of beams are presented in Table 5.
The bending test results
|
Specimen |
Pmax (kN) |
Vertical deflection (mm) |
|
Beam 1 |
242.22 |
77.97 |
|
Beam 2 |
241.98 |
83.23 |
|
Beam 3 |
226.00 |
78.07 |
The load capacity
The effect of the shear connection degree
a. Determines the shear connection degree for beam 1 and beam 3.
The plastic axial resistance of the steel girder (class 1):
N = Af/g
= [(19.4 - 2×0.9)×0.6 + 2×15×0.9]×28.4/1.0
= 1066.70 kN
The plastic axial resistance of the concrete slab:
N = bh0.85f/g
= 50×10×0.85×3.67/1.0
= 1559.75 kN
Note:
g = 1.0 Partial safety factor of steel
g = 1.0 Partial safety factor of concrete
V = min (N; N) = 1066.70 kN
The number of necessary shear connectors for half beam:
N ³ V/P = 1066.70/141.42 = 7.54 (shear connectors).
As shown in Table 6, beam 1, with 20-shear connectors, was considered a full-shear connection beam, and beam 3 (with 10-shear connectors) was considered a partial-shear connection beam (66.67%).
The load capacity
|
Specimen |
Shear connection degree (%) |
Pmax (kN) |
Increment (%) |
|
Beam 1 |
100.00 |
242.22 |
7.17 |
|
Beam 3 |
66.67 |
226.00 |
- |
The test results show that the capacity of beam 1 only increases by about 7.17% in comparison with that of beam 3.
b. Comparising the load capacity from the bending test with that from the prediction formula.
Beam 1 with full shear connection degree, the height of the compressive concrete slab is:
x = N/(b×0.85f) = 1066.70/(50×0.85×3.67)
= 6.84 cm < h = 10 cm (plastic neutral axis passing through the concrete slab, as shown in Figure 7).
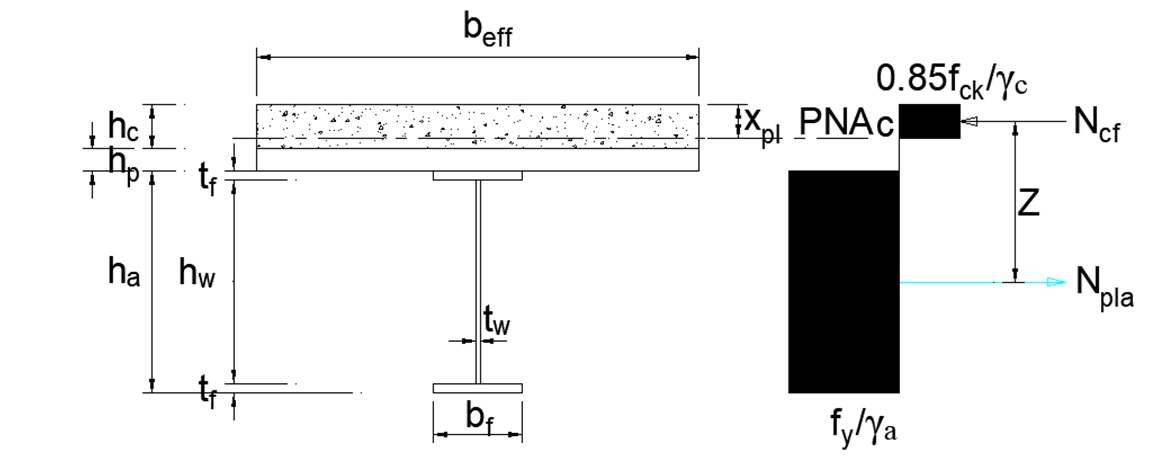
PNA passing through the concrete slab
M = N× (h/2 + h - x/2)
= 1066.70× (19.4/2 + 10 – 6.84/2)
= 15701 kN.cm
= 173.66 kN.m
P = 2M/1.35 = 257.27 kN
Note: value 1.35m is the distance from applied load and support.
Beam 3 with the partial shear connection degree (66.67%) can be determined by the prediction formula following:
M = M + N/N (M – M) 22
With the hot-rolled steel girder I-194×150×6×9 (h = 194 mm, b = 150 mm, t = 9 mm, t = 6 mm), f = 28.4 kN/cm, the plastic moment resistance of the steel girder equals M = 123.71 kN.m
So, M = 123.71 + 10/15(157.01 – 123.71)
= 157.01 kN.m
and P = 2 M/1.35 = 232.61 kN
Where:
M the plastic moment resistance of the steel girder.
M the plastic moment resistance of the steel-concrete composite beam.
M the reduced plastic moment resistance of the steel-concrete composite beam.
Table 7 presents the value of the load capacities of beam 1 and beam 3 with test results and prediction formula. The deviation of them is rather small. Arranging many shear connectors compared to the necessary number of shear connectors does not enhance the load capacity of the steel-concrete composite beams.
The load capacity
|
Spec. |
Shear connect. degree (%) |
Pmax (kN) |
Ppred. (kN) |
Deviation (%) |
|
Beam 1 |
100.00 |
242.22 |
257.27 |
5.84 |
|
Beam 3 |
66.67 |
226.00 |
232.61 |
2.84 |
The effect of the shear connection shape
Beam 1 and beam 2 had different shear connector shapes. The perfobond shear connectors in beam 1 were welded continuously along the steel girder, while the perfobond shear connectors in beam 2 were short intervals. There is a difference between these types of perfobond shear connectors. The load capacity of beam 1 and beam 2 is nearly the same. This can be explained by beam 2 with fourteen shear connectors (with 93.33% full shear connection degree and the gaps between the perfobond were filled by concrete, this enhanced the load capacity of beam 2.
The vertical deflection
The effect of the shear connection degree
The vertical deflection of beam 1 and beam 3 are presented in Table 8. At the mid-span, the vertical deflections of each beam at the failure loads are 77.97 mm and 78.07 mm, respectively. However, at the failure load of beam 3, there is a significant difference in the vertical deflection between these beams. At this load level (P), the vertical of beam 1 is only 39.80 mm, and that of beam 3 is 78.07 mm, as presented in Table 9. This means the vertical deflection of beam 1 equals 50.98% that of beam 3. The vertical deflections of beams at the other locations along the steel-concrete composite beams are also plotted in Figure 8. The test results indicate the effect of the shear connection degree on the vertical deflection of the steel-concrete composite beams. The higher the shear connection degree is, the smaller the vertical deflection is. This can be explained by the steel-concrete composite beam with the higher shear connection degree restricting the relative slip between the hot-rolled steel girder and the concrete slab. This leads to enhanced behavior together between the steel girder and concrete slab.
The vertical deflection
|
Spec. |
Shear connection degree (%) |
Pmax (kN) |
Vertical deflection (mm) |
|
Beam 1 |
100.00 |
242.22 |
77.97 |
|
Beam 3 |
66.67 |
226.00 |
78.07 |
The vertical deflection at Pmax,3
|
Spec. |
Shear connection degree (%) |
Pmax (kN) |
Vertical deflection (mm) |
|
Beam 1 |
100.00 |
226.00 |
39.80 |
|
Beam 3 |
66.67 |
226.00 |
78.07 |
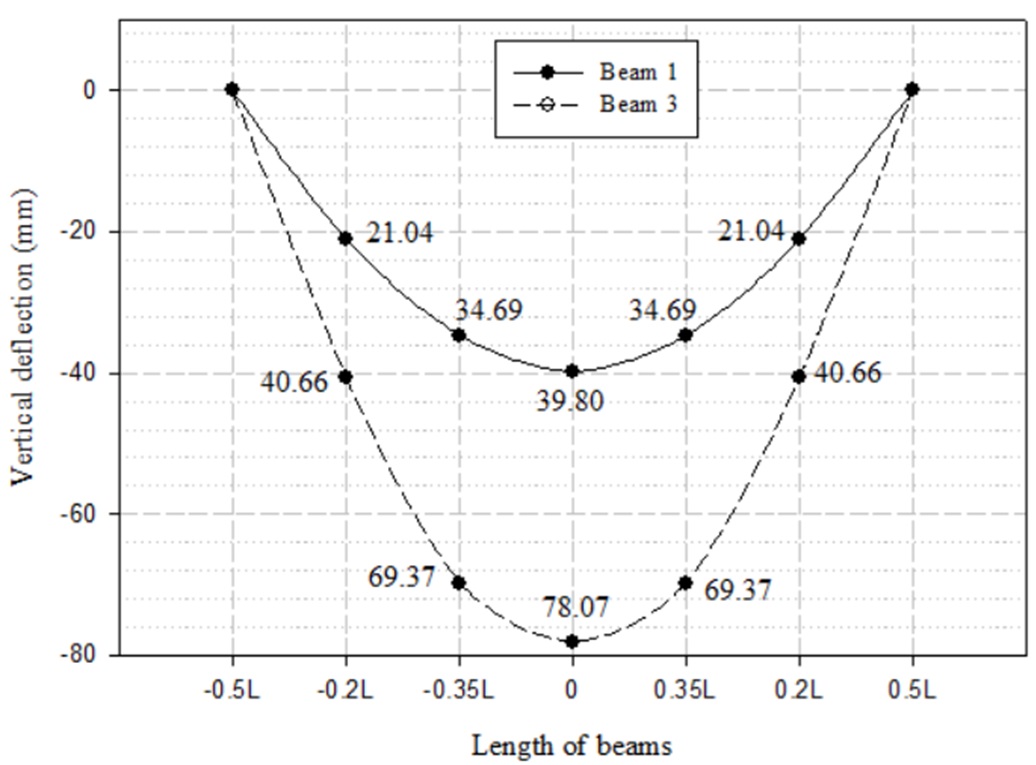
The vertical deflection of Beam 1 & Beam 3 at the failure load of Beam 3 (Pmax,3)
The effect of the shear connection shape
The vertical deflections of Beam 1 and Beam 2 at the failure load are 77.97 mm and 83.23 mm, respectively, as shown in Table 10 and Figure 9. Similar to the load capacity, there is nearly no distinction in the vertical deflection between these steel-concrete composite beams. At the load failure of Beam 2 (P), the vertical deflection of Beam 1 is smaller than that of Beam 2. However, this distinction is not clear, the vertical deflection of Beam 1 equals 92.35% the vertical deflection of Beam 2, as shown in Figure 10.
The vertical deflection at Pmax,2
|
Spec. |
Shear connection degree (%) |
Pmax (kN) |
Vertical deflection (mm) |
|
Beam 1 |
100 |
241.98 |
76.86 |
|
Beam 2 |
100 |
241.98 |
83.23 |
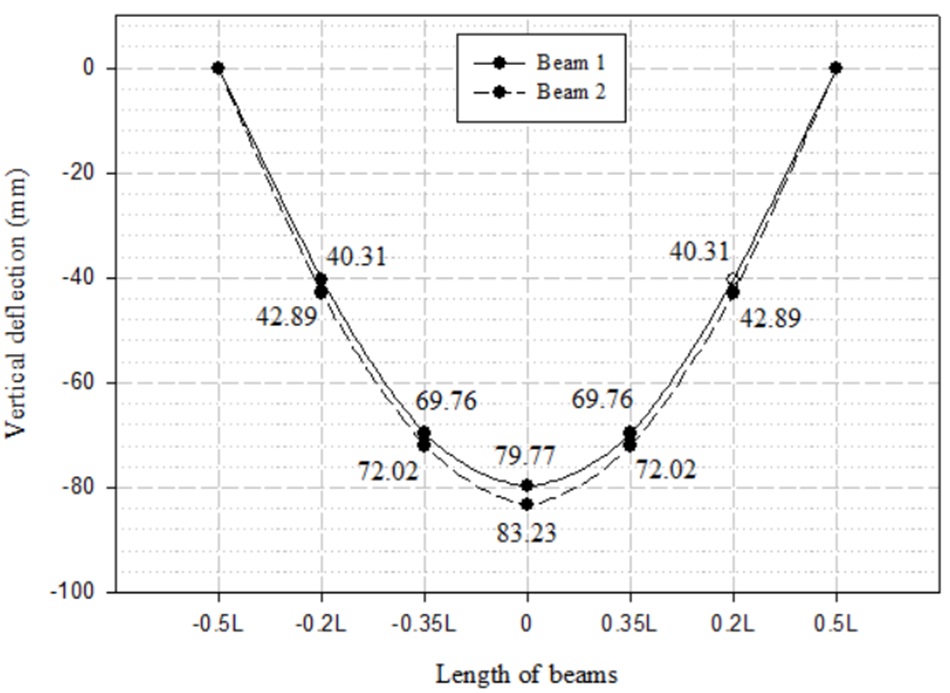
The vertical deflection of Beam 1 & Beam 2 at the failure load of Beam 1 and Beam 2
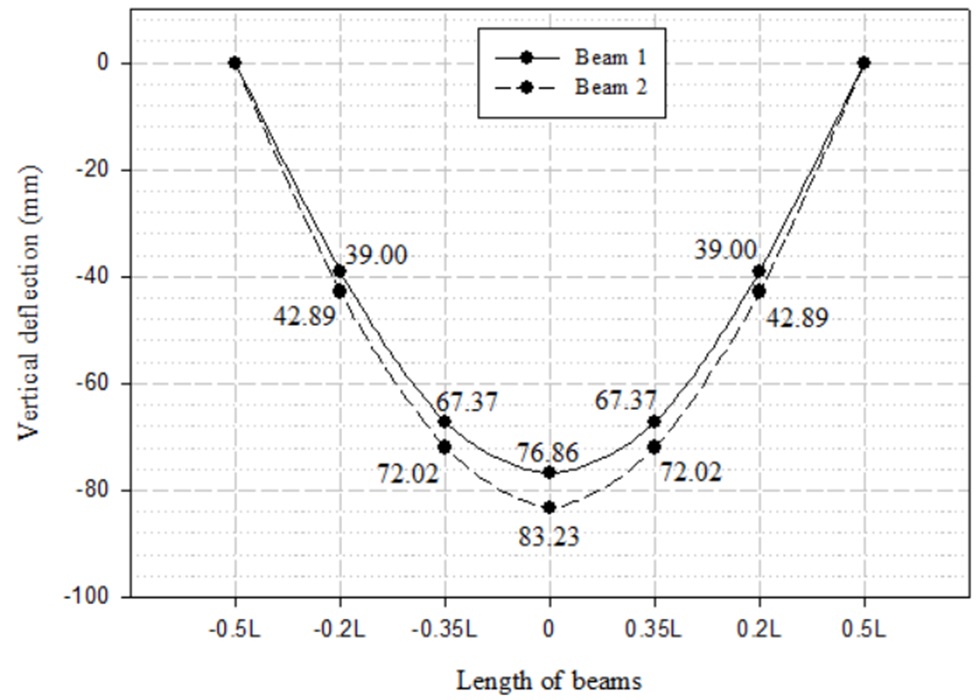
The vertical deflection of Beam 1 & Beam 2 at the failure load of Beam 2 (Pmax,2)
Conclusion
Experimental studies on three steel-concrete composite beams with different shear connection degrees and shapes, some suggestions are drawn out as follows:
No need to arrange over-shear connectors for steel-concrete composite beams with full shear connection degree. This does not enhance the load capacity and reduce the vertical deflection of the steel-concrete composite beams.
The values obtained from test results are rather identical to those of the predicted formula. The value of the experiment is reliable.
The shear connection degree affects the load capacity of the steel-concrete composite beam, conforming to the formula that determines the load capacity following the shear connection degree.
For the steel-concrete composite beam with a full shear connection degree, the shear connector shape almost does not affect the bending behavior of the steel-concrete composite beams.
Acknowledgment
We acknowledge Ho Chi Minh City University of Technology (HCMUT), VNU-HCM for supporting this study.
Conflict of Interest
The authors would like to declare that there is no conflict of interest in publishing the article.
Author contribution
Thai Hoa Dinh collected the data, Van Phuoc Nhan Le explained, gave ideas and content, and wrote the article.